Hertz 2014 Annual Report Download - page 63
Download and view the complete annual report
Please find page 63 of the 2014 Hertz annual report below. You can navigate through the pages in the report by either clicking on the pages listed below, or by using the keyword search tool below to find specific information within the annual report.-
 1
1 -
2
-
3
-
4
-
5
-
6
-
7
-
8
-
9
-
10
-
11
-
12
-
13
-
14
-
15
-
16
-
17
-
18
-
19
-
20
-
21
-
22
-
23
-
24
-
25
-
26
-
27
-
28
-
29
-
30
-
31
-
32
-
33
-
34
-
35
-
36
-
37
-
38
-
39
-
40
-
41
-
42
-
43
-
44
-
45
-
46
-
47
-
48
-
49
-
50
-
51
-
52
-
 53
53 -
 54
54 -
 55
55 -
 56
56 -
 57
57 -
 58
58 -
 59
59 -
 60
60 -
 61
61 -
 62
62 -
 63
63 -
 64
64 -
 65
65 -
 66
66 -
 67
67 -
 68
68 -
 69
69 -
 70
70 -
 71
71 -
 72
72 -
 73
73 -
74
-
75
-
76
-
77
-
78
-
79
-
80
-
81
-
82
-
83
-
84
-
85
-
86
-
87
-
88
-
89
-
90
-
91
-
92
-
93
-
94
-
95
-
96
-
97
-
98
-
99
-
100
-
101
-
102
-
103
-
104
-
105
-
106
-
107
-
108
-
109
-
110
-
111
-
112
-
113
-
114
-
115
-
116
-
117
-
118
-
119
-
120
-
121
-
122
-
123
-
124
-
125
-
126
-
127
-
128
-
129
-
130
-
131
-
132
-
133
-
134
-
135
-
136
-
137
-
138
-
139
-
140
-
141
-
142
-
143
-
144
-
145
-
146
-
147
-
148
-
149
-
150
-
151
-
152
-
153
-
154
-
155
-
156
-
157
-
158
-
159
-
160
-
161
-
162
-
163
-
164
-
165
-
166
-
167
-
168
-
169
-
170
-
171
-
172
-
173
-
174
-
175
-
176
-
177
-
178
-
179
-
180
-
181
-
182
-
183
-
184
-
185
-
186
-
187
-
188
-
189
-
190
-
191
-
192
-
193
-
194
-
195
-
196
-
197
-
198
-
199
-
200
-
201
-
202
-
203
-
204
-
205
-
206
-
207
-
208
-
209
-
210
-
211
-
212
-
213
-
214
-
215
-
216
-
217
-
218
-
219
-
220
-
221
-
222
-
223
-
224
-
225
-
226
-
227
-
228
-
229
-
230
-
231
-
232
-
233
-
234
-
235
-
236
-
237
-
238
-
239
-
240
-
241
-
242
-
243
-
244
-
245
-
246
-
247
-
248
-
249
-
250
-
251
-
252
-
253
-
254
-
255
-
256
-
257
-
258
-
259
-
260
-
261
-
262
-
263
-
264
-
265
-
266
-
267
-
268
-
269
-
270
-
271
-
272
-
273
-
274
-
275
-
276
-
277
-
278
-
279
-
280
-
281
-
282
-
283
-
284
-
285
-
286
-
287
-
288
-
289
-
290
-
291
-
292
-
293
-
294
-
295
-
296
-
297
-
298
-
299
-
300
-
301
-
302
-
303
-
304
-
305
-
306
-
307
-
308
-
309
-
310
-
311
-
312
-
313
-
314
-
315
-
316
-
317
-
318
-
319
-
320
-
321
-
322
-
323
-
324
-
325
-
326
-
327
-
328
-
329
-
330
-
331
-
332
-
333
-
334
-
335
-
336
-
337
-
338
-
339
-
340
-
341
-
342
-
343
-
344
-
345
-
346
-
347
-
348
-
349
-
350
-
351
-
352
-
353
-
354
-
355
-
356
-
357
-
358
-
359
-
360
-
361
-
362
-
363
-
364
-
365
-
366
-
367
-
368
-
369
-
370
-
371
-
372
-
373
-
374
-
375
-
376
-
377
-
378
-
379
-
380
-
381
-
382
-
383
-
384
-
385
-
386
 |
 |

Table of Contents
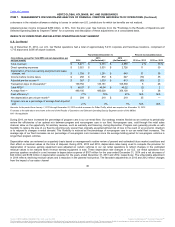
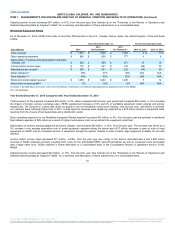
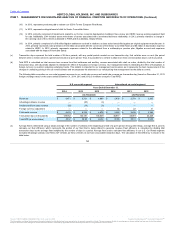
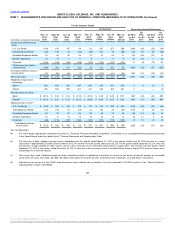
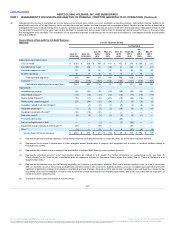
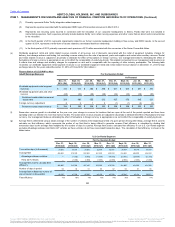
Total revenues for the segment increased $157 million, or 11%, when compared with the prior year and increased $161 million, or 12% excluding
the impact of foreign currency exchange rates, primarily resulting from increased volume of 14% and increased pricing of 3% as well as an
increase in new equipment sales year over year. The increase in volume was primarily due to strong industrial performance, especially oil and gas
related, and improvement in the construction sector driven by the recovery of the non-residential construction industry.
Direct operating expenses for our worldwide equipment rental segment increased $49 million, or 6%, from the prior year primarily comprised of
higher maintenance and vehicle operating costs of $13 million, a $20 million increase in salaries due to merit increases and increased headcount
due to business growth and acquisitions made in 2012, and a $15 million increase in other direct operating expenses resulting from higher
equipment sales costs and facilities expenses. The increases were driven by higher fleet and staffing levels required to meet increased volume
demand.
Depreciation of revenue earning equipment and lease charges, net increased $28 million, or 10%, compared with the prior year driven by a larger
fleet during the period combined with an increase in the average acquisition cost of rental equipment operated during the period, partly offset by
strong residual values and improved disposal channel mix.
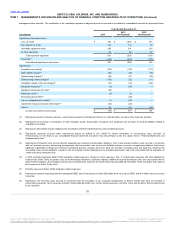
Income before income taxes increased $99 million, or 70%, from the prior year. The increase was primarily due to the factors described above
combined with a $11 million decrease in SG&A expenses. SG&A expense is further described on a consolidated basis in the Consolidated Results
of Operations section of this MD&A.
Adjusted pre-tax income increased $85 million, or 39%, from the prior year. See footnote (b) in the "Footnotes to the Results of Operations and
Selected Operating Data by Segment Tables" for a summary and description of these adjustments on a consolidated basis.
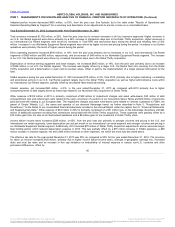
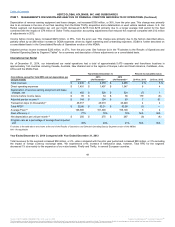
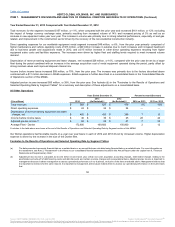
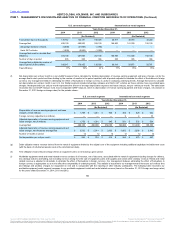
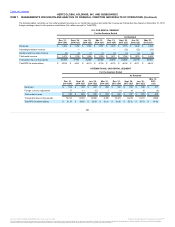
Total revenues $ 568
$ 527
$ 478
8%
10%
Direct operating expenses $ 24
$ 24
$ 24
—
—
Depreciation of revenue earning equipment and lease
charges, net $ 455
$ 425
$ 388
7
10
Income before income taxes $ 46
$ 36
$ 25
28
44
Adjusted pre-tax income (b) $ 62
$ 58
$ 47
7
23
Average Fleet - Donlen 172,800
169,600
150,800
2
12
Our Donlen operations had favorable results on a year over year basis in each of 2014 and 2013 driven by increased volume. Higher depreciation
expense is driven by the increase in the size of the Donlen fleet.
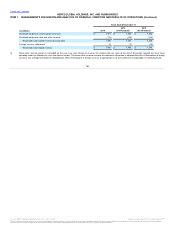
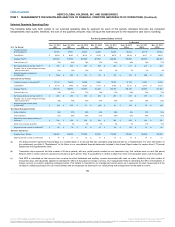
(a) The data presented represents financial data on a restated basis or an amount that was calculated using financial data on a restated basis. For more information on
the restatement, see Note 2, "Restatement" to the Notes to our consolidated financial statements included in this Annual Report under the caption Item 8, "Financial
Statements and Supplementary Data."
(b) Adjusted pre-tax income is calculated as income before income taxes plus certain non-cash acquisition accounting charges, debt-related charges relating to the
amortization and write-off of debt financing costs and debt discounts and certain one-time charges and nonoperational items. Adjusted pre-tax income is important to
management because it allows management to assess operational performance of our business, exclusive of the items mentioned above. Management believes that
it is important to investors for the same reasons it is important to management and because it allows them to assess our operational performance on the same basis
that
52
Source: HERTZ GLOBAL HOLDINGS INC, 10-K, July 16, 2015 Powered by Morningstar® Document Research℠
The information contained herein may not be copied, adapted or distributed and is not warranted to be accurate, complete or timely. The user assumes all risks for any damages or losses arising from any use of this information,
except to the extent such damages or losses cannot be limited or excluded by applicable law. Past financial performance is no guarantee of future results.