Hertz 2014 Annual Report Download - page 204
Download and view the complete annual report
Please find page 204 of the 2014 Hertz annual report below. You can navigate through the pages in the report by either clicking on the pages listed below, or by using the keyword search tool below to find specific information within the annual report.-
 1
1 -
2
-
3
-
4
-
5
-
6
-
7
-
8
-
9
-
10
-
11
-
12
-
13
-
14
-
15
-
16
-
17
-
18
-
19
-
20
-
21
-
22
-
23
-
24
-
25
-
26
-
27
-
28
-
29
-
30
-
31
-
32
-
33
-
34
-
35
-
36
-
37
-
38
-
39
-
40
-
41
-
42
-
43
-
44
-
45
-
46
-
47
-
48
-
49
-
50
-
51
-
52
-
53
-
54
-
55
-
56
-
57
-
58
-
59
-
60
-
61
-
62
-
63
-
64
-
65
-
66
-
67
-
68
-
69
-
70
-
71
-
72
-
73
-
74
-
75
-
76
-
77
-
78
-
79
-
80
-
81
-
82
-
83
-
84
-
85
-
86
-
87
-
88
-
89
-
90
-
91
-
92
-
93
-
94
-
95
-
96
-
97
-
98
-
99
-
100
-
101
-
102
-
103
-
104
-
105
-
106
-
107
-
108
-
109
-
110
-
111
-
112
-
113
-
114
-
115
-
116
-
117
-
118
-
119
-
120
-
121
-
122
-
123
-
124
-
125
-
126
-
127
-
128
-
129
-
130
-
131
-
132
-
133
-
134
-
135
-
136
-
137
-
138
-
139
-
140
-
141
-
142
-
143
-
144
-
145
-
146
-
147
-
148
-
149
-
150
-
151
-
152
-
153
-
154
-
155
-
156
-
157
-
158
-
159
-
160
-
161
-
162
-
163
-
164
-
165
-
166
-
167
-
168
-
169
-
170
-
171
-
172
-
173
-
174
-
175
-
176
-
177
-
178
-
179
-
180
-
181
-
182
-
183
-
184
-
185
-
186
-
187
-
188
-
189
-
190
-
191
-
192
-
193
-
 194
194 -
 195
195 -
 196
196 -
 197
197 -
 198
198 -
 199
199 -
 200
200 -
 201
201 -
 202
202 -
 203
203 -
 204
204 -
 205
205 -
 206
206 -
 207
207 -
 208
208 -
 209
209 -
 210
210 -
 211
211 -
 212
212 -
 213
213 -
 214
214 -
215
-
216
-
217
-
218
-
219
-
220
-
221
-
222
-
223
-
224
-
225
-
226
-
227
-
228
-
229
-
230
-
231
-
232
-
233
-
234
-
235
-
236
-
237
-
238
-
239
-
240
-
241
-
242
-
243
-
244
-
245
-
246
-
247
-
248
-
249
-
250
-
251
-
252
-
253
-
254
-
255
-
256
-
257
-
258
-
259
-
260
-
261
-
262
-
263
-
264
-
265
-
266
-
267
-
268
-
269
-
270
-
271
-
272
-
273
-
274
-
275
-
276
-
277
-
278
-
279
-
280
-
281
-
282
-
283
-
284
-
285
-
286
-
287
-
288
-
289
-
290
-
291
-
292
-
293
-
294
-
295
-
296
-
297
-
298
-
299
-
300
-
301
-
302
-
303
-
304
-
305
-
306
-
307
-
308
-
309
-
310
-
311
-
312
-
313
-
314
-
315
-
316
-
317
-
318
-
319
-
320
-
321
-
322
-
323
-
324
-
325
-
326
-
327
-
328
-
329
-
330
-
331
-
332
-
333
-
334
-
335
-
336
-
337
-
338
-
339
-
340
-
341
-
342
-
343
-
344
-
345
-
346
-
347
-
348
-
349
-
350
-
351
-
352
-
353
-
354
-
355
-
356
-
357
-
358
-
359
-
360
-
361
-
362
-
363
-
364
-
365
-
366
-
367
-
368
-
369
-
370
-
371
-
372
-
373
-
374
-
375
-
376
-
377
-
378
-
379
-
380
-
381
-
382
-
383
-
384
-
385
-
386
 |
 |

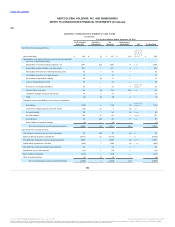
Table of Contents
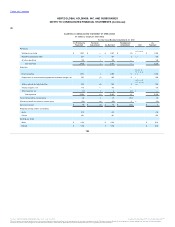
Cash flows from operating activities:
Net income (loss) $ 139
$ (2)
$ 137
$ (20)
a, b, c, d, e,
f, g, i, j, m
,n, o, p, q, r,
s
$ 117
Adjustments to reconcile net income (loss) to net cash provided
by (used in) operating activities:
Depreciation of revenue earning equipment, net 1,195
(21)
1,174
12
f, r, j
1,186
Depreciation and amortization, non-fleet assets 163
—
163
4
i, r
167
Amortization and write-off of deferred financing costs 26
—
26
—
26
Amortization and write-off of debt discount 11
—
11
—
11
Stock-based compensation charges 20
(2)
18
—
18
Loss on extinguishment of debt —
—
—
—
—
Provision for receivables allowance 33
—
33
2
a, b, c, d, e,
g, j, r
35
Deferred taxes on income 94
(2)
92
(14)
r, s
78
Impairment charges and asset write-downs 2
—
2
—
2
Other (6)
1
(5)
1
r
(4)
Changes in assets and liabilities, net of effects of acquisition:
Receivables (239)
8
(231)
2
a, b, c, d, e,
g, j, r
(229)
Inventories, prepaid expenses and other assets (59)
24
(35)
(1)
n, r
(36)
Accounts payable 85
—
85
4
k, p, r
89
Accrued liabilities (6)
10
4
1
o, q, r
5
Accrued taxes 16
(27)
(11)
5
s, j
(6)
Public liability and property damage (15)
—
(15)
—
(15)
Net cash provided by (used in) operating activities 1,459
(11)
1,448
(4)
1,444
Cash flows from investing activities:
Net change in restricted cash and cash equivalents 175
(20)
155
(2)
k
153
Revenue earning equipment expenditures (6,826)
17
(6,809)
(3)
h
(6,812)
Proceeds from disposal of revenue earning equipment 3,743
—
3,743
(5)
h, f, r
3,738
Capital asset expenditures, non-fleet (168)
—
(168)
2
i, r, p
(166)
Proceeds from disposal of property and equipment 43
—
43
2
i
45
Acquisitions, net of cash acquired (16)
—
(16)
2
(14)
Equity method investment (213)
—
(213)
—
(213)
Other investing activities (2)
—
(2)
(2)
r
(4)
Net cash provided by (used in) investing activities (3,264)
(3)
(3,267)
(6)
(3,273)
192
Source: HERTZ GLOBAL HOLDINGS INC, 10-K, July 16, 2015 Powered by Morningstar® Document Research℠
The information contained herein may not be copied, adapted or distributed and is not warranted to be accurate, complete or timely. The user assumes all risks for any damages or losses arising from any use of this information,
except to the extent such damages or losses cannot be limited or excluded by applicable law. Past financial performance is no guarantee of future results.