Hertz 2014 Annual Report Download - page 274
Download and view the complete annual report
Please find page 274 of the 2014 Hertz annual report below. You can navigate through the pages in the report by either clicking on the pages listed below, or by using the keyword search tool below to find specific information within the annual report.-
 1
1 -
2
-
3
-
4
-
5
-
6
-
7
-
8
-
9
-
10
-
11
-
12
-
13
-
14
-
15
-
16
-
17
-
18
-
19
-
20
-
21
-
22
-
23
-
24
-
25
-
26
-
27
-
28
-
29
-
30
-
31
-
32
-
33
-
34
-
35
-
36
-
37
-
38
-
39
-
40
-
41
-
42
-
43
-
44
-
45
-
46
-
47
-
48
-
49
-
50
-
51
-
52
-
53
-
54
-
55
-
56
-
57
-
58
-
59
-
60
-
61
-
62
-
63
-
64
-
65
-
66
-
67
-
68
-
69
-
70
-
71
-
72
-
73
-
74
-
75
-
76
-
77
-
78
-
79
-
80
-
81
-
82
-
83
-
84
-
85
-
86
-
87
-
88
-
89
-
90
-
91
-
92
-
93
-
94
-
95
-
96
-
97
-
98
-
99
-
100
-
101
-
102
-
103
-
104
-
105
-
106
-
107
-
108
-
109
-
110
-
111
-
112
-
113
-
114
-
115
-
116
-
117
-
118
-
119
-
120
-
121
-
122
-
123
-
124
-
125
-
126
-
127
-
128
-
129
-
130
-
131
-
132
-
133
-
134
-
135
-
136
-
137
-
138
-
139
-
140
-
141
-
142
-
143
-
144
-
145
-
146
-
147
-
148
-
149
-
150
-
151
-
152
-
153
-
154
-
155
-
156
-
157
-
158
-
159
-
160
-
161
-
162
-
163
-
164
-
165
-
166
-
167
-
168
-
169
-
170
-
171
-
172
-
173
-
174
-
175
-
176
-
177
-
178
-
179
-
180
-
181
-
182
-
183
-
184
-
185
-
186
-
187
-
188
-
189
-
190
-
191
-
192
-
193
-
194
-
195
-
196
-
197
-
198
-
199
-
200
-
201
-
202
-
203
-
204
-
205
-
206
-
207
-
208
-
209
-
210
-
211
-
212
-
213
-
214
-
215
-
216
-
217
-
218
-
219
-
220
-
221
-
222
-
223
-
224
-
225
-
226
-
227
-
228
-
229
-
230
-
231
-
232
-
233
-
234
-
235
-
236
-
237
-
238
-
239
-
240
-
241
-
242
-
243
-
244
-
245
-
246
-
247
-
248
-
249
-
250
-
251
-
252
-
253
-
254
-
255
-
256
-
257
-
258
-
259
-
260
-
261
-
262
-
263
-
 264
264 -
 265
265 -
 266
266 -
 267
267 -
 268
268 -
 269
269 -
 270
270 -
 271
271 -
 272
272 -
 273
273 -
 274
274 -
 275
275 -
 276
276 -
 277
277 -
 278
278 -
 279
279 -
 280
280 -
 281
281 -
 282
282 -
 283
283 -
 284
284 -
285
-
286
-
287
-
288
-
289
-
290
-
291
-
292
-
293
-
294
-
295
-
296
-
297
-
298
-
299
-
300
-
301
-
302
-
303
-
304
-
305
-
306
-
307
-
308
-
309
-
310
-
311
-
312
-
313
-
314
-
315
-
316
-
317
-
318
-
319
-
320
-
321
-
322
-
323
-
324
-
325
-
326
-
327
-
328
-
329
-
330
-
331
-
332
-
333
-
334
-
335
-
336
-
337
-
338
-
339
-
340
-
341
-
342
-
343
-
344
-
345
-
346
-
347
-
348
-
349
-
350
-
351
-
352
-
353
-
354
-
355
-
356
-
357
-
358
-
359
-
360
-
361
-
362
-
363
-
364
-
365
-
366
-
367
-
368
-
369
-
370
-
371
-
372
-
373
-
374
-
375
-
376
-
377
-
378
-
379
-
380
-
381
-
382
-
383
-
384
-
385
-
386
 |
 |

Table of Contents
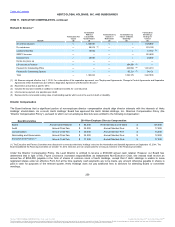
supplemental measure because such information is utilized in the calculation of financial covenants under Hertz's senior credit facilities and in the
determination of certain executive compensation.
Corporate EBITDA Margin is calculated as the ratio of Corporate EBITDA to total revenues and is used by the Compensation Committee to
determine certain executive compensation, primarily in the form of PSUs.
EBITDA, Corporate EBITDA and Corporate EBITDA Margin are not recognized measurements under U.S. GAAP. When evaluating our operating
performance or liquidity, investors should not consider EBITDA and Corporate EBITDA in isolation of, or as a substitute for, measures of our
financial performance and liquidity as determined in accordance with U.S. GAAP, such as net income, operating income or net cash provided by
operating activities.
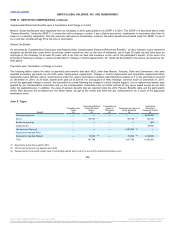
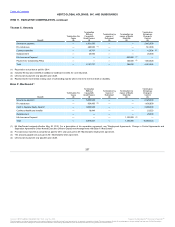
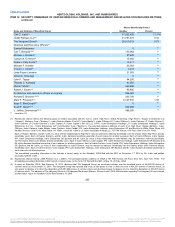
The following tables reconcile income (loss) before income taxes, the most comparable U.S. GAAP measure, to EBITDA and Corporate EBITDA
and presents the calculation of Corporate EBITDA Margin utilizing the U.S. GAAP measure total revenues, in each case of Hertz Holdings.
(In millions)
Income (loss) before income taxes
$ (23)
$ 603
$ 365
Depreciation and amortization
3,400
2,872
2,389
Interest, net of interest income
648
707
647
EBITDA
$ 4,025
$ 4,182
$ 3,401
Car rental fleet depreciation
(2,705)
(2,234)
(1,857)
Car rental fleet interest
(277)
(302)
(297)
Car rental fleet debt - related charges (b)
31
32
37
Non-cash stock-based employee compensation charges (c)
10
35
30
Restructuring and restructuring related charges (d)
165
99
49
Acquisition related costs and charges (e)
10
19
147
Integration expenses (f)
9
43
—
Equipment Rental spin-off costs (g)
39
—
—
Relocation costs (h)
9
7
—
Premiums paid on debt (i)
—
29
—
Loss on extinguishment of debt (j)
1
35
—
Impairment charges and asset write-downs (k)
34
40
—
Other extraordinary, unusual or non-recurring items(l)
(20)
16
44
Corporate EBITDA
$ 1,331
$ 2,001
$ 1,554
Total Revenues
11,046
10,775
9,013
Corporate EBITDA Margin
12%
19%
17%
(a) For further details regarding the restatement see Note 2, "Restatement" to the Notes to our consolidated financial statements included in this Annual Report under the
caption Item 8, "Financial Statements and Supplementary Data."
(b) Represents non-cash charges relating to the amortization of deferred debt financing costs and debt discounts.
(c) For twelve months ended December 31, 2014, excludes $6 million of stock-based compensation forfeitures included in restructuring and restructuring related
charges.
(d) Represents expenses incurred under restructuring actions as defined in U.S. GAAP. For further information on restructuring costs, see Note 15 "Restructuring," to
the Notes to our consolidated financial statements included in this Annual Report under the caption Item 8, "Financial Statements and Supplementary Data" and
incremental costs incurred directly supporting our business transformation initiatives. Such costs include transition costs incurred in connection with our business
process outsourcing arrangements and incremental costs incurred to facilitate business process re-engineering initiatives that involve significant organization
redesign and extensive operational process changes. Amount in 2014 also includes consulting costs and legal fees related to the accounting review and investigation,
one-time costs to terminate certain marketing and co-branding agreements, and costs associated with the separation of certain executives during the year.
(e) In 2012, primarily represents Dollar Thrifty acquisition related expenses, change in control expenses, 'Day-1' compensation expenses and other adjustments related
to the Dollar Thrifty acquisition, loss on the Advantage divestiture, expenses related to additional required divestitures and costs associated with the Dollar Thrifty
acquisition and a gain on the investment in Dollar Thrifty stock.
(f) Primarily represents Dollar Thrifty integration related expenses.
262
Source: HERTZ GLOBAL HOLDINGS INC, 10-K, July 16, 2015 Powered by Morningstar® Document Research℠
The information contained herein may not be copied, adapted or distributed and is not warranted to be accurate, complete or timely. The user assumes all risks for any damages or losses arising from any use of this information,
except to the extent such damages or losses cannot be limited or excluded by applicable law. Past financial performance is no guarantee of future results.