Hertz 2014 Annual Report Download - page 251
Download and view the complete annual report
Please find page 251 of the 2014 Hertz annual report below. You can navigate through the pages in the report by either clicking on the pages listed below, or by using the keyword search tool below to find specific information within the annual report.-
 1
1 -
2
-
3
-
4
-
5
-
6
-
7
-
8
-
9
-
10
-
11
-
12
-
13
-
14
-
15
-
16
-
17
-
18
-
19
-
20
-
21
-
22
-
23
-
24
-
25
-
26
-
27
-
28
-
29
-
30
-
31
-
32
-
33
-
34
-
35
-
36
-
37
-
38
-
39
-
40
-
41
-
42
-
43
-
44
-
45
-
46
-
47
-
48
-
49
-
50
-
51
-
52
-
53
-
54
-
55
-
56
-
57
-
58
-
59
-
60
-
61
-
62
-
63
-
64
-
65
-
66
-
67
-
68
-
69
-
70
-
71
-
72
-
73
-
74
-
75
-
76
-
77
-
78
-
79
-
80
-
81
-
82
-
83
-
84
-
85
-
86
-
87
-
88
-
89
-
90
-
91
-
92
-
93
-
94
-
95
-
96
-
97
-
98
-
99
-
100
-
101
-
102
-
103
-
104
-
105
-
106
-
107
-
108
-
109
-
110
-
111
-
112
-
113
-
114
-
115
-
116
-
117
-
118
-
119
-
120
-
121
-
122
-
123
-
124
-
125
-
126
-
127
-
128
-
129
-
130
-
131
-
132
-
133
-
134
-
135
-
136
-
137
-
138
-
139
-
140
-
141
-
142
-
143
-
144
-
145
-
146
-
147
-
148
-
149
-
150
-
151
-
152
-
153
-
154
-
155
-
156
-
157
-
158
-
159
-
160
-
161
-
162
-
163
-
164
-
165
-
166
-
167
-
168
-
169
-
170
-
171
-
172
-
173
-
174
-
175
-
176
-
177
-
178
-
179
-
180
-
181
-
182
-
183
-
184
-
185
-
186
-
187
-
188
-
189
-
190
-
191
-
192
-
193
-
194
-
195
-
196
-
197
-
198
-
199
-
200
-
201
-
202
-
203
-
204
-
205
-
206
-
207
-
208
-
209
-
210
-
211
-
212
-
213
-
214
-
215
-
216
-
217
-
218
-
219
-
220
-
221
-
222
-
223
-
224
-
225
-
226
-
227
-
228
-
229
-
230
-
231
-
232
-
233
-
234
-
235
-
236
-
237
-
238
-
239
-
240
-
 241
241 -
 242
242 -
 243
243 -
 244
244 -
 245
245 -
 246
246 -
 247
247 -
 248
248 -
 249
249 -
 250
250 -
 251
251 -
 252
252 -
 253
253 -
 254
254 -
 255
255 -
 256
256 -
 257
257 -
 258
258 -
 259
259 -
 260
260 -
 261
261 -
262
-
263
-
264
-
265
-
266
-
267
-
268
-
269
-
270
-
271
-
272
-
273
-
274
-
275
-
276
-
277
-
278
-
279
-
280
-
281
-
282
-
283
-
284
-
285
-
286
-
287
-
288
-
289
-
290
-
291
-
292
-
293
-
294
-
295
-
296
-
297
-
298
-
299
-
300
-
301
-
302
-
303
-
304
-
305
-
306
-
307
-
308
-
309
-
310
-
311
-
312
-
313
-
314
-
315
-
316
-
317
-
318
-
319
-
320
-
321
-
322
-
323
-
324
-
325
-
326
-
327
-
328
-
329
-
330
-
331
-
332
-
333
-
334
-
335
-
336
-
337
-
338
-
339
-
340
-
341
-
342
-
343
-
344
-
345
-
346
-
347
-
348
-
349
-
350
-
351
-
352
-
353
-
354
-
355
-
356
-
357
-
358
-
359
-
360
-
361
-
362
-
363
-
364
-
365
-
366
-
367
-
368
-
369
-
370
-
371
-
372
-
373
-
374
-
375
-
376
-
377
-
378
-
379
-
380
-
381
-
382
-
383
-
384
-
385
-
386
 |
 |
Table of Contents
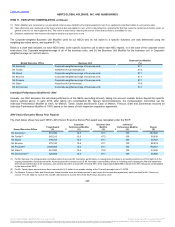
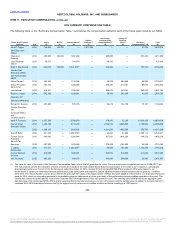
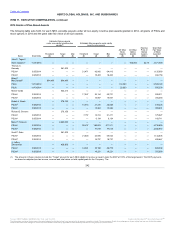
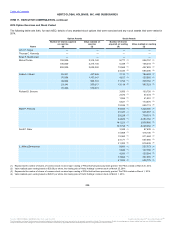
The following table, or the “Summary Compensation Table,” summarizes the compensation earned in each of the fiscal years noted by our NEOs.
‑
John P. Tague
2014
145,000
108,750
—
3,571,000
—
—
51,764
3,876,514
Thomas C.
Kennedy
2014
660,000
326,835
1,607,239
—
280,500
—
537,226
3,411,800
2013
38,077
—
341,576
—
48,165
—
—
427,818
Brian P. MacDonald
2014
634,616
125,000
3,015,370(5)
—
834,493
—
157,154
4,766,633
Michel Taride(6)
2014
633,322
—
1,315,004
—
59,638
663,898
68,809
2,740,671
‑‑
2013
587,735
—
1,266,586
—
498,200
210,381
89,940
2,652,842
2012
579,431
—
1,058,954
—
498,873
323,591
360,253
2,821,102
Robert J. Stuart
2014
502,308
—
1,168,887
—
38,703
267,200
41,683
2,018,781
Richard D. Broome
2014
391,404
—
535,738
—
28,219
164,100
73,181
1,192,642
Mark P. Frissora
2014
1,037,308
—
6,769,870
—
178,047
52,700
10,815,109
18,853,034
2013
1,423,750
—
8,174,233
—
2,748,734
2,835,800
1,156,042
16,338,559
2012
1,308,750
—
6,452,426
—
4,211,096
1,952,200
592,796
14,517,268
Scott P. Sider
2014
431,539
—
3,250,070(7)
—
33,406
37,800
2,785,116
6,537,931
‑‑
2013
645,000
—
2,200,844
—
437,861
1,414,200
184,373
4,882,278
2012
587,500
—
1,576,449
—
775,609
1,754,900
24,904
4,719,362
J. Jeffrey
Zimmerman
2014
511,077
—
2,253,006(7)
—
40,696
181,000
1,732,759
4,718,538
2013
515,000
—
1,308,461
—
462,072
314,500
611,632
3,211,665
2012
487,625
—
939,158
—
643,096
359,600
22,486
2,451,965
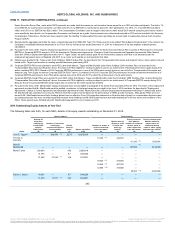
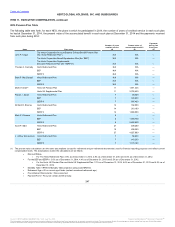
(1) The value for each of the years in this Summary Compensation Table reflects the full grant date fair value. These amounts were computed pursuant to FASB ASC Topic
718. Assumptions used in the calculation of these amounts are included in the note entitled “Stock‑Based Compensation” in the notes to our Company’s consolidated
financial statements in our Form 10‑K for the fiscal year ended December 31, 2014. Vesting of the Corporate EBITDA PSUs granted in 2014 were subject to our
achievement of certain pre‑determined financial performance goals during 2014 and subject to upward adjustment based on financial performance goals for combined
2014‑2015. The “Stock Awards” column above reflects the grant date fair values of the target number of PSUs that were eligible to vest based on our financial performance
goals for 2014, which for accounting purposes is the probable outcome (determined as of the grant date) of the performance‑based condition applicable to the grant. This
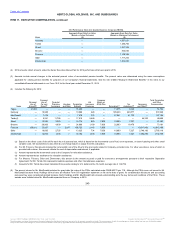
column also reflects the grant date fair value of the Corporate EBITDA margin‑based PSUs also granted in 2014. The following table below presents the aggregate grant
date fair value of the Corporate EBITDA PSUs grants assuming that (i) the actual outcome occurred, a 0% payout, and the awards were not subject to increase based on
combined 2014‑2015 financial performance and (ii) the highest level of performance condition would be achieved, resulting in a 150% payout.
239
Source: HERTZ GLOBAL HOLDINGS INC, 10-K, July 16, 2015 Powered by Morningstar® Document Research℠
The information contained herein may not be copied, adapted or distributed and is not warranted to be accurate, complete or timely. The user assumes all risks for any damages or losses arising from any use of this information,
except to the extent such damages or losses cannot be limited or excluded by applicable law. Past financial performance is no guarantee of future results.