Hertz 2014 Annual Report Download - page 239
Download and view the complete annual report
Please find page 239 of the 2014 Hertz annual report below. You can navigate through the pages in the report by either clicking on the pages listed below, or by using the keyword search tool below to find specific information within the annual report.-
 1
1 -
2
-
3
-
4
-
5
-
6
-
7
-
8
-
9
-
10
-
11
-
12
-
13
-
14
-
15
-
16
-
17
-
18
-
19
-
20
-
21
-
22
-
23
-
24
-
25
-
26
-
27
-
28
-
29
-
30
-
31
-
32
-
33
-
34
-
35
-
36
-
37
-
38
-
39
-
40
-
41
-
42
-
43
-
44
-
45
-
46
-
47
-
48
-
49
-
50
-
51
-
52
-
53
-
54
-
55
-
56
-
57
-
58
-
59
-
60
-
61
-
62
-
63
-
64
-
65
-
66
-
67
-
68
-
69
-
70
-
71
-
72
-
73
-
74
-
75
-
76
-
77
-
78
-
79
-
80
-
81
-
82
-
83
-
84
-
85
-
86
-
87
-
88
-
89
-
90
-
91
-
92
-
93
-
94
-
95
-
96
-
97
-
98
-
99
-
100
-
101
-
102
-
103
-
104
-
105
-
106
-
107
-
108
-
109
-
110
-
111
-
112
-
113
-
114
-
115
-
116
-
117
-
118
-
119
-
120
-
121
-
122
-
123
-
124
-
125
-
126
-
127
-
128
-
129
-
130
-
131
-
132
-
133
-
134
-
135
-
136
-
137
-
138
-
139
-
140
-
141
-
142
-
143
-
144
-
145
-
146
-
147
-
148
-
149
-
150
-
151
-
152
-
153
-
154
-
155
-
156
-
157
-
158
-
159
-
160
-
161
-
162
-
163
-
164
-
165
-
166
-
167
-
168
-
169
-
170
-
171
-
172
-
173
-
174
-
175
-
176
-
177
-
178
-
179
-
180
-
181
-
182
-
183
-
184
-
185
-
186
-
187
-
188
-
189
-
190
-
191
-
192
-
193
-
194
-
195
-
196
-
197
-
198
-
199
-
200
-
201
-
202
-
203
-
204
-
205
-
206
-
207
-
208
-
209
-
210
-
211
-
212
-
213
-
214
-
215
-
216
-
217
-
218
-
219
-
220
-
221
-
222
-
223
-
224
-
225
-
226
-
227
-
228
-
 229
229 -
 230
230 -
 231
231 -
 232
232 -
 233
233 -
 234
234 -
 235
235 -
 236
236 -
 237
237 -
 238
238 -
 239
239 -
 240
240 -
 241
241 -
 242
242 -
 243
243 -
 244
244 -
 245
245 -
 246
246 -
 247
247 -
 248
248 -
 249
249 -
250
-
251
-
252
-
253
-
254
-
255
-
256
-
257
-
258
-
259
-
260
-
261
-
262
-
263
-
264
-
265
-
266
-
267
-
268
-
269
-
270
-
271
-
272
-
273
-
274
-
275
-
276
-
277
-
278
-
279
-
280
-
281
-
282
-
283
-
284
-
285
-
286
-
287
-
288
-
289
-
290
-
291
-
292
-
293
-
294
-
295
-
296
-
297
-
298
-
299
-
300
-
301
-
302
-
303
-
304
-
305
-
306
-
307
-
308
-
309
-
310
-
311
-
312
-
313
-
314
-
315
-
316
-
317
-
318
-
319
-
320
-
321
-
322
-
323
-
324
-
325
-
326
-
327
-
328
-
329
-
330
-
331
-
332
-
333
-
334
-
335
-
336
-
337
-
338
-
339
-
340
-
341
-
342
-
343
-
344
-
345
-
346
-
347
-
348
-
349
-
350
-
351
-
352
-
353
-
354
-
355
-
356
-
357
-
358
-
359
-
360
-
361
-
362
-
363
-
364
-
365
-
366
-
367
-
368
-
369
-
370
-
371
-
372
-
373
-
374
-
375
-
376
-
377
-
378
-
379
-
380
-
381
-
382
-
383
-
384
-
385
-
386
 |
 |

Table of Contents
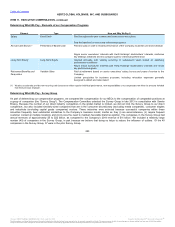
Adjusted
Pre‑Tax
Income ("API")
40%
No
Equal to our income before acquisition accounting charges,
non‑cash interest items, income taxes, minority interest,
restructuring expenses, significant one‑time items and non‑cash
“mark‑to‑market” income and expense
API allows management to assess the
operational performance of our business,
exclusive of the items previously mentioned
that do not reflect our operating performance
Return on
Total Capital
40%
No
Equal to API plus our gross interest expense and the expense
for equity awards divided by the average total capital balance for
each of the four relevant quarters. Total capital balance is
defined as average assets, including goodwill, other intangibles
and other acquisition accounting related balances, minus
average non-interest bearing liabilities
Return on total capital measures our
profitability relative to our capital structure
Revenue
20%
Yes
Our Company’s revenue
Revenue is a strong indicator of how our
Company is performing overall
The Compensation Committee set goals for each of API, return on total capital and revenue. The Compensation Committee then measured our
performance against each of the goals to determine a modifier for each financial performance element and an overall Corporate Performance
Modifier. The target level for each of API, revenue and return on total capital was based upon our business plan.
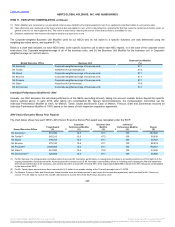
The following were the fiscal 2014 financial performance criteria targets set by the Compensation Committee and our actual performance as
compared to such targets (dollars in millions):
Threshold(1)
$1,196.3
$10,971.6
12.11%
Target = 100% Multiplier
$1,329.2
$11,549.1
13.46%
High Performance Level(2)
$1,528.6
$12,415.3
15.48%
Actual Results
$417.9
$11,017.6
5.99%
Payout Factor
0.0%
63.2%
0.0%
Corporate Performance Modifier
12.6%
(1)Any API, revenue or return on total capital results that equal the threshold receive a 60% multiplier. Any API, revenue or return on total capital results that are below
the threshold receive a 0% multiplier.
(2)Any API, revenue or return on total capital results that equal the high performance level receive a 160% multiplier.
For financial performance criteria, linear interpolation was used to determine the multiplier for results that were between the threshold and target
and target and high performance level.
We disclosed our actual API, as well as detailed reconciliations of this Non‑GAAP measure, in Part II, Item 7 “
of this Annual Report on Form 10-K under the caption
.
We calculate return on total capital as (1) net operating profit before taxes divided by (2) total capital. We calculate net operating profit before taxes
as API plus our gross interest expense and the expense for equity awards. Total capital for any particular quarter is calculated as average assets,
including goodwill, other intangibles and other acquisition accounting related balances, minus average non-interest bearing liabilities. In order to
determine an annual amount for total capital, we take the sum of the total capital balance for each of the four relevant quarters and divide by 4.
227
Source: HERTZ GLOBAL HOLDINGS INC, 10-K, July 16, 2015 Powered by Morningstar® Document Research℠
The information contained herein may not be copied, adapted or distributed and is not warranted to be accurate, complete or timely. The user assumes all risks for any damages or losses arising from any use of this information,
except to the extent such damages or losses cannot be limited or excluded by applicable law. Past financial performance is no guarantee of future results.