Hertz 2014 Annual Report Download - page 194
Download and view the complete annual report
Please find page 194 of the 2014 Hertz annual report below. You can navigate through the pages in the report by either clicking on the pages listed below, or by using the keyword search tool below to find specific information within the annual report.-
 1
1 -
2
-
3
-
4
-
5
-
6
-
7
-
8
-
9
-
10
-
11
-
12
-
13
-
14
-
15
-
16
-
17
-
18
-
19
-
20
-
21
-
22
-
23
-
24
-
25
-
26
-
27
-
28
-
29
-
30
-
31
-
32
-
33
-
34
-
35
-
36
-
37
-
38
-
39
-
40
-
41
-
42
-
43
-
44
-
45
-
46
-
47
-
48
-
49
-
50
-
51
-
52
-
53
-
54
-
55
-
56
-
57
-
58
-
59
-
60
-
61
-
62
-
63
-
64
-
65
-
66
-
67
-
68
-
69
-
70
-
71
-
72
-
73
-
74
-
75
-
76
-
77
-
78
-
79
-
80
-
81
-
82
-
83
-
84
-
85
-
86
-
87
-
88
-
89
-
90
-
91
-
92
-
93
-
94
-
95
-
96
-
97
-
98
-
99
-
100
-
101
-
102
-
103
-
104
-
105
-
106
-
107
-
108
-
109
-
110
-
111
-
112
-
113
-
114
-
115
-
116
-
117
-
118
-
119
-
120
-
121
-
122
-
123
-
124
-
125
-
126
-
127
-
128
-
129
-
130
-
131
-
132
-
133
-
134
-
135
-
136
-
137
-
138
-
139
-
140
-
141
-
142
-
143
-
144
-
145
-
146
-
147
-
148
-
149
-
150
-
151
-
152
-
153
-
154
-
155
-
156
-
157
-
158
-
159
-
160
-
161
-
162
-
163
-
164
-
165
-
166
-
167
-
168
-
169
-
170
-
171
-
172
-
173
-
174
-
175
-
176
-
177
-
178
-
179
-
180
-
181
-
182
-
183
-
 184
184 -
 185
185 -
 186
186 -
 187
187 -
 188
188 -
 189
189 -
 190
190 -
 191
191 -
 192
192 -
 193
193 -
 194
194 -
 195
195 -
 196
196 -
 197
197 -
 198
198 -
 199
199 -
 200
200 -
 201
201 -
 202
202 -
 203
203 -
 204
204 -
205
-
206
-
207
-
208
-
209
-
210
-
211
-
212
-
213
-
214
-
215
-
216
-
217
-
218
-
219
-
220
-
221
-
222
-
223
-
224
-
225
-
226
-
227
-
228
-
229
-
230
-
231
-
232
-
233
-
234
-
235
-
236
-
237
-
238
-
239
-
240
-
241
-
242
-
243
-
244
-
245
-
246
-
247
-
248
-
249
-
250
-
251
-
252
-
253
-
254
-
255
-
256
-
257
-
258
-
259
-
260
-
261
-
262
-
263
-
264
-
265
-
266
-
267
-
268
-
269
-
270
-
271
-
272
-
273
-
274
-
275
-
276
-
277
-
278
-
279
-
280
-
281
-
282
-
283
-
284
-
285
-
286
-
287
-
288
-
289
-
290
-
291
-
292
-
293
-
294
-
295
-
296
-
297
-
298
-
299
-
300
-
301
-
302
-
303
-
304
-
305
-
306
-
307
-
308
-
309
-
310
-
311
-
312
-
313
-
314
-
315
-
316
-
317
-
318
-
319
-
320
-
321
-
322
-
323
-
324
-
325
-
326
-
327
-
328
-
329
-
330
-
331
-
332
-
333
-
334
-
335
-
336
-
337
-
338
-
339
-
340
-
341
-
342
-
343
-
344
-
345
-
346
-
347
-
348
-
349
-
350
-
351
-
352
-
353
-
354
-
355
-
356
-
357
-
358
-
359
-
360
-
361
-
362
-
363
-
364
-
365
-
366
-
367
-
368
-
369
-
370
-
371
-
372
-
373
-
374
-
375
-
376
-
377
-
378
-
379
-
380
-
381
-
382
-
383
-
384
-
385
-
386
 |
 |

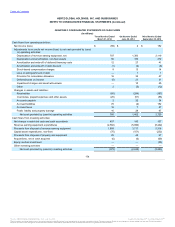
Table of Contents
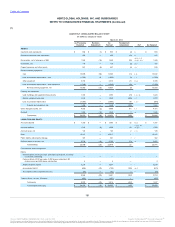
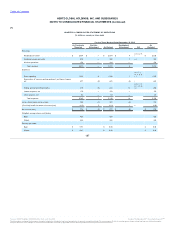
Cash and cash equivalents $ 483
$ (1)
$ 482
$ (15)
k
$ 467
Restricted cash and cash equivalents 393
—
393
(3)
k
390
Receivables, net of allowance of $56 1,656
(16)
1,640
(95)
a, b, c, d,
e, g, j, m, r
1,545
Inventories, net 128
—
128
(1)
p, r
127
Prepaid expenses and other assets 765
(3)
762
(4)
n, r
758
Revenue earning equipment:
Cars 15,490
(63)
15,427
(9)
j, p
15,418
Less accumulated depreciation - cars (2,169)
49
(2,120)
(5)
j, r
(2,125)
Other equipment 3,425
—
3,425
27
h, p
3,452
Less accumulated depreciation - other equipment (1,040)
—
(1,040)
(22)
h
(1,062)
Revenue earning equipment, net 15,706
(14)
15,692
(9)
15,683
Property and equipment:
Land, buildings and leasehold improvements 1,334
—
1,334
(93)
i, l, r, q
1,241
Service equipment and other 1,258
—
1,258
(217)
i, l
1,041
Less accumulated depreciation (1,126)
—
(1,126)
105
i, l, r
(1,021)
Property and equipment, net 1,466
—
1,466
(205)
1,261
Other intangible assets, net 3,969
(2)
3,967
169
l, r
4,136
Goodwill 1,366
(7)
1,359
4
q
1,363
Total assets $ 25,932
$ (43)
$ 25,889
$ (159)
$ 25,730
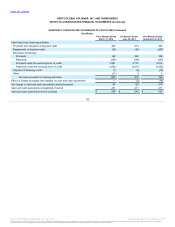
Accounts payable $ 1,484
$ 1
$ 1,485
$ 35
k, p
$ 1,520
Accrued liabilities 1,184
2
1,186
59
f, g, j, m, o,
q, t
1,245
Accrued taxes, net 135
(1)
134
3
r, s
137
Debt 17,842
—
17,842
—
17,842
Public liability and property damage 328
—
328
—
328
Deferred taxes on income, net 2,795
(20)
2,775
(76)
s
2,699
Total liabilities 23,768
(18)
23,750
21
23,771
Commitments and contingencies
Equity:
Preferred Stock, $0.01 par value, 200 shares authorized, no shares
issued and outstanding —
—
—
—
—
Common Stock, $0.01 par value, 2,000 shares authorized, 425
shares issued and 401 shares outstanding 4
—
4
—
4
Additional paid-in capital 3,265
(2)
3,263
1
r
3,264
Accumulated deficit (565)
(23)
(588)
(179)
a - t
(767)
Accumulated other comprehensive loss (73)
—
(73)
(2)
q, t
(75)
2,631
(25)
2,606
(180)
2,426
Treasury Stock, at cost, 23 shares (467)
—
(467)
—
(467)
Total equity 2,164
(25)
2,139
(180)
1,959
Total liabilities and equity $ 25,932
$ (43)
$ 25,889
$ (159)
$ 25,730
182
Source: HERTZ GLOBAL HOLDINGS INC, 10-K, July 16, 2015 Powered by Morningstar® Document Research℠
The information contained herein may not be copied, adapted or distributed and is not warranted to be accurate, complete or timely. The user assumes all risks for any damages or losses arising from any use of this information,
except to the extent such damages or losses cannot be limited or excluded by applicable law. Past financial performance is no guarantee of future results.