Hertz 2014 Annual Report Download - page 247
Download and view the complete annual report
Please find page 247 of the 2014 Hertz annual report below. You can navigate through the pages in the report by either clicking on the pages listed below, or by using the keyword search tool below to find specific information within the annual report.
Table of Contents
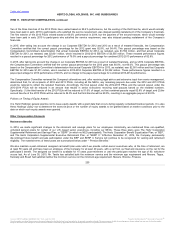
Two of the three tranches of the 2012 PSUs have vested based on 98.4% performance, but the vesting of the third tranche, which would normally
have been paid in early 2015 to participants who satisfied the service requirement, was delayed pending restatement of the Company’s financials.
The first tranche of the 2013 PSUs vested based on 66.0% performance in 2014, but the payment of the second tranche, which would normally
have been paid in early 2015 to participants who satisfied the service requirement, was also delayed pending restatement of the Company’s
financials.
In 2015, after taking into account the change in our Corporate EBITDA for 2012 and 2013 as a result of restated financials, the Compensation
Committee certified that the correct payout percentage for the 2012 grant was 82.8%, not 98.4%. This payout percentage was based on the
Compensation Committee’s determination that actual Corporate EBITDA for 2012, as restated, was $1,554 million, and that actual Corporate
EBITDA for 2013, as restated, was $2,001 million, which resulted in 2012-2013 EBITDA of $3,555 million. These restated performance figures
resulted in a payout percentage for 2012 performance of 78.9% and a payout percentage for combined 2012-2013 performance of 82.8%.
In 2015, after taking into account the change in our Corporate EBITDA for 2013 as a result of restated financials, and our 2014 Corporate EBITDA,
the Compensation Committee certified that the correct payout percentage for the 2013 grant was 60.0%, not 66.0%. This payout percentage was
based on the Compensation Committee’s determination that actual Corporate EBITDA for 2013, as restated, was $2,001 million and that Corporate
EBITDA for 2014 was $1,331 million, which resulted in 2013-2014 Corporate EBITDA of $3,332 million. These performance figures resulted in a
payout percentage for 2013 performance of 60.0% and no change to the payout percentage for combined 2013-2014 performance.
The Compensation Committee reviewed the Company's alternatives and, after receiving legal advice and extensive input from senior management,
determined that, for all recipients of 2012 and 2013 PSUs, including all the NEOs, any remaining payouts due under the 2012 and 2013 PSUs
would be reduced to reflect the restated financials. Accordingly, the final payout under the 2012-2013 PSUs and the second payout under the
2013-2014 PSUs will be reduced in an amount that results in senior executives receiving total payouts based on the restated numbers.
Specifically, (1) the third tranche of the 2012 PSUs will be reduced to 51.6% of target, so that combined payouts equal 82.8% of target, and (2) the
second tranche of the 2013 PSUs will be reduced to 54.0% and the third tranche will be 60.0%, resulting in an aggregate payout of 60.0%.
It is Hertz Holdings’ general practice not to issue equity awards with a grant date that occurs during regularly scheduled blackout periods. It is also
Hertz Holdings’ policy not to determine the exercise price or the number of equity awards to be granted based on market conditions prior to the
date on which such equity awards were granted.
In 2014, we made significant changes to the retirement and savings plans for our employees. Historically, we maintained three non‑qualified,
unfunded pension plans for certain of our U.S.‑based senior executives, including our NEOs. These three plans were The Hertz Corporation
Supplemental Retirement and Savings Plan, or “SERP” (in which no NEO participated), The Hertz Corporation Benefit Equalization Plan, or “BEP,”
and The Hertz Corporation Supplemental Executive Retirement Plan, or “SERP II.” Effective December 31, 2014, the Company permanently
discontinued future benefit accruals participation under the BEP and SERP II. Service will continue to be recognized for vesting and retirement
eligibility. The material terms of these plans are summarized below under “- Pension Benefits.”
We also maintain a post‑retirement assigned car benefit plan under which we provide certain senior executives who, at the time of retirement, are
at least 58 years old and have been an employee of the Company for at least 20 years, with a car from our fleet and insurance on the car for the
participant’s benefit. The assigned car benefit is available for 15 years post‑retirement or until the participant reaches the age of 80, whichever
occurs last. As of June 30, 2015, Mr. Taride has satisfied both the minimum service and the minimum age requirement and Messrs. Tague,
Kennedy and Stuart had satisfied neither the minimum service nor the minimum age requirement. Messrs. Broome, Frissora,
235
Source: HERTZ GLOBAL HOLDINGS INC, 10-K, July 16, 2015 Powered by Morningstar® Document Research℠
The information contained herein may not be copied, adapted or distributed and is not warranted to be accurate, complete or timely. The user assumes all risks for any damages or losses arising from any use of this information,
except to the extent such damages or losses cannot be limited or excluded by applicable law. Past financial performance is no guarantee of future results.


