Hertz 2014 Annual Report Download - page 65
Download and view the complete annual report
Please find page 65 of the 2014 Hertz annual report below. You can navigate through the pages in the report by either clicking on the pages listed below, or by using the keyword search tool below to find specific information within the annual report.-
 1
1 -
2
-
3
-
4
-
5
-
6
-
7
-
8
-
9
-
10
-
11
-
12
-
13
-
14
-
15
-
16
-
17
-
18
-
19
-
20
-
21
-
22
-
23
-
24
-
25
-
26
-
27
-
28
-
29
-
30
-
31
-
32
-
33
-
34
-
35
-
36
-
37
-
38
-
39
-
40
-
41
-
42
-
43
-
44
-
45
-
46
-
47
-
48
-
49
-
50
-
51
-
52
-
53
-
54
-
 55
55 -
 56
56 -
 57
57 -
 58
58 -
 59
59 -
 60
60 -
 61
61 -
 62
62 -
 63
63 -
 64
64 -
 65
65 -
 66
66 -
 67
67 -
 68
68 -
 69
69 -
 70
70 -
 71
71 -
 72
72 -
 73
73 -
 74
74 -
 75
75 -
76
-
77
-
78
-
79
-
80
-
81
-
82
-
83
-
84
-
85
-
86
-
87
-
88
-
89
-
90
-
91
-
92
-
93
-
94
-
95
-
96
-
97
-
98
-
99
-
100
-
101
-
102
-
103
-
104
-
105
-
106
-
107
-
108
-
109
-
110
-
111
-
112
-
113
-
114
-
115
-
116
-
117
-
118
-
119
-
120
-
121
-
122
-
123
-
124
-
125
-
126
-
127
-
128
-
129
-
130
-
131
-
132
-
133
-
134
-
135
-
136
-
137
-
138
-
139
-
140
-
141
-
142
-
143
-
144
-
145
-
146
-
147
-
148
-
149
-
150
-
151
-
152
-
153
-
154
-
155
-
156
-
157
-
158
-
159
-
160
-
161
-
162
-
163
-
164
-
165
-
166
-
167
-
168
-
169
-
170
-
171
-
172
-
173
-
174
-
175
-
176
-
177
-
178
-
179
-
180
-
181
-
182
-
183
-
184
-
185
-
186
-
187
-
188
-
189
-
190
-
191
-
192
-
193
-
194
-
195
-
196
-
197
-
198
-
199
-
200
-
201
-
202
-
203
-
204
-
205
-
206
-
207
-
208
-
209
-
210
-
211
-
212
-
213
-
214
-
215
-
216
-
217
-
218
-
219
-
220
-
221
-
222
-
223
-
224
-
225
-
226
-
227
-
228
-
229
-
230
-
231
-
232
-
233
-
234
-
235
-
236
-
237
-
238
-
239
-
240
-
241
-
242
-
243
-
244
-
245
-
246
-
247
-
248
-
249
-
250
-
251
-
252
-
253
-
254
-
255
-
256
-
257
-
258
-
259
-
260
-
261
-
262
-
263
-
264
-
265
-
266
-
267
-
268
-
269
-
270
-
271
-
272
-
273
-
274
-
275
-
276
-
277
-
278
-
279
-
280
-
281
-
282
-
283
-
284
-
285
-
286
-
287
-
288
-
289
-
290
-
291
-
292
-
293
-
294
-
295
-
296
-
297
-
298
-
299
-
300
-
301
-
302
-
303
-
304
-
305
-
306
-
307
-
308
-
309
-
310
-
311
-
312
-
313
-
314
-
315
-
316
-
317
-
318
-
319
-
320
-
321
-
322
-
323
-
324
-
325
-
326
-
327
-
328
-
329
-
330
-
331
-
332
-
333
-
334
-
335
-
336
-
337
-
338
-
339
-
340
-
341
-
342
-
343
-
344
-
345
-
346
-
347
-
348
-
349
-
350
-
351
-
352
-
353
-
354
-
355
-
356
-
357
-
358
-
359
-
360
-
361
-
362
-
363
-
364
-
365
-
366
-
367
-
368
-
369
-
370
-
371
-
372
-
373
-
374
-
375
-
376
-
377
-
378
-
379
-
380
-
381
-
382
-
383
-
384
-
385
-
386
 |
 |

Table of Contents
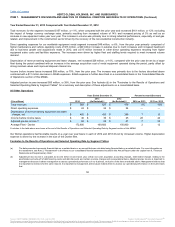
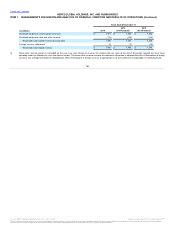
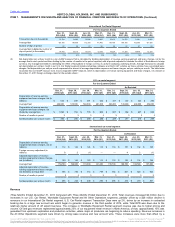
(10) In 2013, represents premiums paid to redeem our 8.50% Former European Fleet Notes.
(11) In 2013, represents extinguishment of debt for Senior Convertible Notes.
(12) In 2014, primarily comprised of impairments related to our former corporate headquarters building in New Jersey and HERC revenue earning equipment held
for sale. Additionally, 2014 includes asset write-downs of assets associated with a terminated business relationship. In 2013, primarily related to a change in
the carrying value of the vehicles subleased to FSNA and its subsidiary, Simply Wheelz.
(13) In 2014, primarily comprised of a $19 million litigation settlement received in relation to a class action lawsuit filed against an original equipment manufacturer. In
2013, primarily represents cash premiums of $12 million associated with the conversion of the Senior Convertible Notes and $5 million of depreciation expense
related to HERC. In 2012, primarily represents expenses related to the withdrawal from a multiemployer pension plan, litigation accrual and expenses
associated with the impact of Hurricane Sandy.
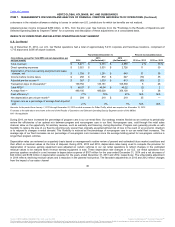
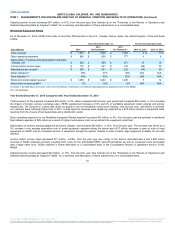
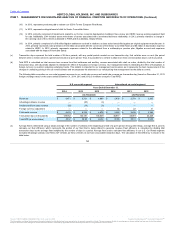
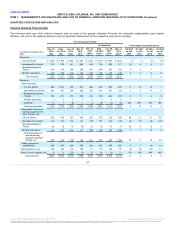
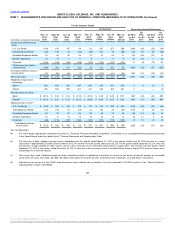
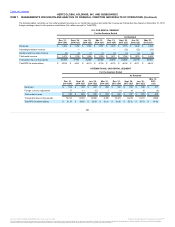
(c) Transaction days represent the total number of 24-hour periods, with any partial period counted as one transaction day, that vehicles were on rent (the period
between when a rental contract is opened and closed) in a given period. Thus, it is possible for a vehicle to attain more than one transaction day in a 24-hour period.
(d) Total RPD is calculated as total revenue less revenue from fleet subleases and ancillary revenue associated with retail car sales, divided by the total number of
transaction days, with all periods adjusted to eliminate the effect of fluctuations in foreign currency. Our management believes eliminating the effect of fluctuations in
foreign currency is useful in analyzing underlying trends. This statistic is important to our management and investors as it represents the best measurement of the
changes in underlying pricing in the car rental business and encompasses the elements in car rental pricing that management has the ability to control.
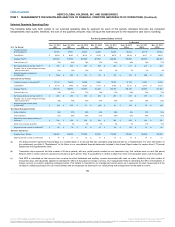
The following table reconciles our car rental segment revenues to our rental rate revenue and rental rate revenue per transaction day (based on December 31, 2013
foreign exchange rates) for the years ended December 31, 2014, 2013 and 2012 ($ in millions except for Total RPD):
Revenues $ 6,471
$ 6,331
$ 4,888
$ 2,436
$ 2,378
$ 2,265
Advantage sublease revenue —
(65)
(4)
—
—
—
Ancillary retail car sales revenue (32)
(14)
(6)
—
—
—
Foreign currency adjustment —
—
—
44
22
31
Total rental revenue $ 6,439
$ 6,252
$ 4,878
$ 2,480
$ 2,400
$ 2,296
Transaction days (in thousands) 139,752
133,181
105,539
46,917
45,019
43,248
Total RPD (in whole dollars) $ 46.07
$ 46.94
$ 46.22
$ 52.86
$ 53.31
$ 53.09
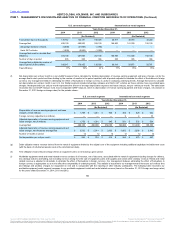
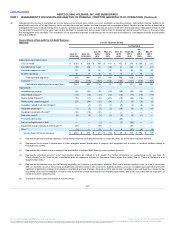
(e) Average fleet is determined using a simple average of the number of vehicles at the beginning and end of a given period. Among other things, average fleet is used to
calculate our fleet efficiency which represents the portion of our fleet that is being utilized to generate revenue. Fleet efficiency is calculated by dividing total
transaction days by the average fleet multiplied by the number of days in a period. Average fleet used to calculate fleet efficiency in our U.S. Car Rental segment
excludes Advantage sublease and Hertz 24/7 vehicles as these vehicles do not have associated transaction days. The calculation of fleet efficiency is shown in the
table below.
54
Source: HERTZ GLOBAL HOLDINGS INC, 10-K, July 16, 2015 Powered by Morningstar® Document Research℠
The information contained herein may not be copied, adapted or distributed and is not warranted to be accurate, complete or timely. The user assumes all risks for any damages or losses arising from any use of this information,
except to the extent such damages or losses cannot be limited or excluded by applicable law. Past financial performance is no guarantee of future results.