Hertz 2014 Annual Report Download - page 121
Download and view the complete annual report
Please find page 121 of the 2014 Hertz annual report below. You can navigate through the pages in the report by either clicking on the pages listed below, or by using the keyword search tool below to find specific information within the annual report.-
 1
1 -
2
-
3
-
4
-
5
-
6
-
7
-
8
-
9
-
10
-
11
-
12
-
13
-
14
-
15
-
16
-
17
-
18
-
19
-
20
-
21
-
22
-
23
-
24
-
25
-
26
-
27
-
28
-
29
-
30
-
31
-
32
-
33
-
34
-
35
-
36
-
37
-
38
-
39
-
40
-
41
-
42
-
43
-
44
-
45
-
46
-
47
-
48
-
49
-
50
-
51
-
52
-
53
-
54
-
55
-
56
-
57
-
58
-
59
-
60
-
61
-
62
-
63
-
64
-
65
-
66
-
67
-
68
-
69
-
70
-
71
-
72
-
73
-
74
-
75
-
76
-
77
-
78
-
79
-
80
-
81
-
82
-
83
-
84
-
85
-
86
-
87
-
88
-
89
-
90
-
91
-
92
-
93
-
94
-
95
-
96
-
97
-
98
-
99
-
100
-
101
-
102
-
103
-
104
-
105
-
106
-
107
-
108
-
109
-
110
-
 111
111 -
 112
112 -
 113
113 -
 114
114 -
 115
115 -
 116
116 -
 117
117 -
 118
118 -
 119
119 -
 120
120 -
 121
121 -
 122
122 -
 123
123 -
 124
124 -
 125
125 -
 126
126 -
 127
127 -
 128
128 -
 129
129 -
 130
130 -
 131
131 -
132
-
133
-
134
-
135
-
136
-
137
-
138
-
139
-
140
-
141
-
142
-
143
-
144
-
145
-
146
-
147
-
148
-
149
-
150
-
151
-
152
-
153
-
154
-
155
-
156
-
157
-
158
-
159
-
160
-
161
-
162
-
163
-
164
-
165
-
166
-
167
-
168
-
169
-
170
-
171
-
172
-
173
-
174
-
175
-
176
-
177
-
178
-
179
-
180
-
181
-
182
-
183
-
184
-
185
-
186
-
187
-
188
-
189
-
190
-
191
-
192
-
193
-
194
-
195
-
196
-
197
-
198
-
199
-
200
-
201
-
202
-
203
-
204
-
205
-
206
-
207
-
208
-
209
-
210
-
211
-
212
-
213
-
214
-
215
-
216
-
217
-
218
-
219
-
220
-
221
-
222
-
223
-
224
-
225
-
226
-
227
-
228
-
229
-
230
-
231
-
232
-
233
-
234
-
235
-
236
-
237
-
238
-
239
-
240
-
241
-
242
-
243
-
244
-
245
-
246
-
247
-
248
-
249
-
250
-
251
-
252
-
253
-
254
-
255
-
256
-
257
-
258
-
259
-
260
-
261
-
262
-
263
-
264
-
265
-
266
-
267
-
268
-
269
-
270
-
271
-
272
-
273
-
274
-
275
-
276
-
277
-
278
-
279
-
280
-
281
-
282
-
283
-
284
-
285
-
286
-
287
-
288
-
289
-
290
-
291
-
292
-
293
-
294
-
295
-
296
-
297
-
298
-
299
-
300
-
301
-
302
-
303
-
304
-
305
-
306
-
307
-
308
-
309
-
310
-
311
-
312
-
313
-
314
-
315
-
316
-
317
-
318
-
319
-
320
-
321
-
322
-
323
-
324
-
325
-
326
-
327
-
328
-
329
-
330
-
331
-
332
-
333
-
334
-
335
-
336
-
337
-
338
-
339
-
340
-
341
-
342
-
343
-
344
-
345
-
346
-
347
-
348
-
349
-
350
-
351
-
352
-
353
-
354
-
355
-
356
-
357
-
358
-
359
-
360
-
361
-
362
-
363
-
364
-
365
-
366
-
367
-
368
-
369
-
370
-
371
-
372
-
373
-
374
-
375
-
376
-
377
-
378
-
379
-
380
-
381
-
382
-
383
-
384
-
385
-
386
 |
 |

Table of Contents
results may differ substantially from the estimates that were based on the critical assumptions. The Company uses a December 31 measurement
date for all of the plans.
Actual results that differ from the Company's assumptions are accumulated and amortized over future periods and, therefore, generally affect its
recognized expense in such future periods. Significant differences in actual experience or significant changes in assumptions would affect the
Company's pension costs and obligations. The Company recognizes the funded status of each defined benefit pension plan in the consolidated
balance sheet. Each overfunded plan is recognized as an asset, and each underfunded plan is recognized as a liability. Pension plan liabilities are
revalued annually based on updated assumptions and information about the individuals covered by the plan. For pension plans, if accumulated
actuarial gains and losses are in excess of a 10 percent corridor, the prior service cost and the transition asset are amortized on a straight-line
basis from the date recognized over the average remaining service period of active participants.
The Company maintains reserves for employee medical claims, up to its insurance stop-loss limit, and workers’ compensation claims. These are
regularly evaluated and revised, as needed, based on a variety of information, including historical experience, actuarial estimates and current
employee statistics.
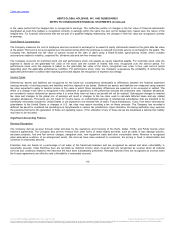
Recoverability of Goodwill and Intangible Assets
On an annual basis and at interim periods when circumstances require, the Company tests the recoverability of its goodwill and indefinite-lived
intangible assets. The Company utilizes the two-step impairment analysis and elects not to use the qualitative assessment or “step zero”
approach. In the two-step impairment analysis, the Company compares the carrying value of each identified reporting unit to its fair value. If the
carrying value of the reporting unit is greater than its fair value, the second step is performed, where the implied fair value of goodwill is compared
to its carrying value. The Company recognizes an impairment charge for the amount by which the carrying amount of goodwill exceeds its implied
fair value. The fair values of the reporting units are estimated using the net present value of discounted cash flows generated by each reporting
unit and incorporate various assumptions related to discount and growth rates specific to the reporting unit to which they are applied. The
Company’s discounted cash flows are based upon reasonable and appropriate assumptions, which are weighted for their likely probability of
occurrence, about the underlying business activities of the Company’s reporting units.
Finite Lived Intangible Assets
Intangible assets include concession agreements, technology, customer relationships, trademarks and trade-names and other intangibles.
Intangible assets with finite lives are amortized using the straight-line method over the estimated economic lives of the assets, which range from
two to fifteen years. Long-lived assets, including intangible assets with finite lives, are reviewed for impairment whenever events or changes in
circumstances indicate that the carrying amount of such assets may not be recoverable. Determination of recoverability is based on an estimate
of undiscounted future cash flows resulting from the use of the asset and its eventual disposition. Measurement of an impairment loss for long-
lived assets that management expects to hold and use is based on the estimated fair value of the asset. Long-lived assets to be disposed of are
reported at the lower of carrying amount or estimated fair value less costs to sell.
Financial Instruments
The Company is exposed to a variety of market risks, including the effects of changes in interest rates, gasoline and diesel fuel prices and foreign
currency exchange rates. The Company manages exposure to these market risks through regular operating and financing activities and, when
deemed appropriate, through the use of financial instruments. Financial instruments are viewed as risk management tools and have not been used
for speculative or trading purposes. In addition, financial instruments are entered into with a diversified group of major financial institutions in order
to manage the Company's exposure to counterparty nonperformance on such instruments. The Company accounts for all financial instruments in
accordance with U.S.GAAP, which requires that they be recorded on the balance sheet as either assets or liabilities measured at their fair value.
For financial instruments that are designated and qualify as hedging instruments, the Company designates the hedging instrument, based upon the
exposure being hedged, as either a fair value hedge or a cash flow hedge. The effective portion of changes in fair value of financial instruments
designated as cash flow hedging instruments is recorded as a component of other comprehensive income (loss). Amounts included in
accumulated other comprehensive income (loss) for cash flow hedges are reclassified into earnings
109
Source: HERTZ GLOBAL HOLDINGS INC, 10-K, July 16, 2015 Powered by Morningstar® Document Research℠
The information contained herein may not be copied, adapted or distributed and is not warranted to be accurate, complete or timely. The user assumes all risks for any damages or losses arising from any use of this information,
except to the extent such damages or losses cannot be limited or excluded by applicable law. Past financial performance is no guarantee of future results.