Hertz 2014 Annual Report Download - page 64
Download and view the complete annual report
Please find page 64 of the 2014 Hertz annual report below. You can navigate through the pages in the report by either clicking on the pages listed below, or by using the keyword search tool below to find specific information within the annual report.-
 1
1 -
2
-
3
-
4
-
5
-
6
-
7
-
8
-
9
-
10
-
11
-
12
-
13
-
14
-
15
-
16
-
17
-
18
-
19
-
20
-
21
-
22
-
23
-
24
-
25
-
26
-
27
-
28
-
29
-
30
-
31
-
32
-
33
-
34
-
35
-
36
-
37
-
38
-
39
-
40
-
41
-
42
-
43
-
44
-
45
-
46
-
47
-
48
-
49
-
50
-
51
-
52
-
53
-
 54
54 -
 55
55 -
 56
56 -
 57
57 -
 58
58 -
 59
59 -
 60
60 -
 61
61 -
 62
62 -
 63
63 -
 64
64 -
 65
65 -
 66
66 -
 67
67 -
 68
68 -
 69
69 -
 70
70 -
 71
71 -
 72
72 -
 73
73 -
 74
74 -
75
-
76
-
77
-
78
-
79
-
80
-
81
-
82
-
83
-
84
-
85
-
86
-
87
-
88
-
89
-
90
-
91
-
92
-
93
-
94
-
95
-
96
-
97
-
98
-
99
-
100
-
101
-
102
-
103
-
104
-
105
-
106
-
107
-
108
-
109
-
110
-
111
-
112
-
113
-
114
-
115
-
116
-
117
-
118
-
119
-
120
-
121
-
122
-
123
-
124
-
125
-
126
-
127
-
128
-
129
-
130
-
131
-
132
-
133
-
134
-
135
-
136
-
137
-
138
-
139
-
140
-
141
-
142
-
143
-
144
-
145
-
146
-
147
-
148
-
149
-
150
-
151
-
152
-
153
-
154
-
155
-
156
-
157
-
158
-
159
-
160
-
161
-
162
-
163
-
164
-
165
-
166
-
167
-
168
-
169
-
170
-
171
-
172
-
173
-
174
-
175
-
176
-
177
-
178
-
179
-
180
-
181
-
182
-
183
-
184
-
185
-
186
-
187
-
188
-
189
-
190
-
191
-
192
-
193
-
194
-
195
-
196
-
197
-
198
-
199
-
200
-
201
-
202
-
203
-
204
-
205
-
206
-
207
-
208
-
209
-
210
-
211
-
212
-
213
-
214
-
215
-
216
-
217
-
218
-
219
-
220
-
221
-
222
-
223
-
224
-
225
-
226
-
227
-
228
-
229
-
230
-
231
-
232
-
233
-
234
-
235
-
236
-
237
-
238
-
239
-
240
-
241
-
242
-
243
-
244
-
245
-
246
-
247
-
248
-
249
-
250
-
251
-
252
-
253
-
254
-
255
-
256
-
257
-
258
-
259
-
260
-
261
-
262
-
263
-
264
-
265
-
266
-
267
-
268
-
269
-
270
-
271
-
272
-
273
-
274
-
275
-
276
-
277
-
278
-
279
-
280
-
281
-
282
-
283
-
284
-
285
-
286
-
287
-
288
-
289
-
290
-
291
-
292
-
293
-
294
-
295
-
296
-
297
-
298
-
299
-
300
-
301
-
302
-
303
-
304
-
305
-
306
-
307
-
308
-
309
-
310
-
311
-
312
-
313
-
314
-
315
-
316
-
317
-
318
-
319
-
320
-
321
-
322
-
323
-
324
-
325
-
326
-
327
-
328
-
329
-
330
-
331
-
332
-
333
-
334
-
335
-
336
-
337
-
338
-
339
-
340
-
341
-
342
-
343
-
344
-
345
-
346
-
347
-
348
-
349
-
350
-
351
-
352
-
353
-
354
-
355
-
356
-
357
-
358
-
359
-
360
-
361
-
362
-
363
-
364
-
365
-
366
-
367
-
368
-
369
-
370
-
371
-
372
-
373
-
374
-
375
-
376
-
377
-
378
-
379
-
380
-
381
-
382
-
383
-
384
-
385
-
386
 |
 |

Table of Contents
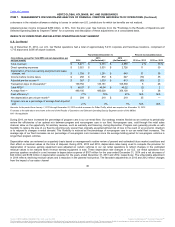
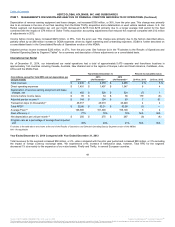
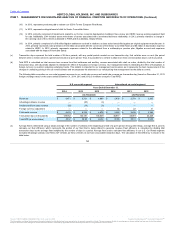
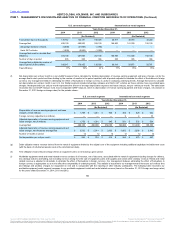
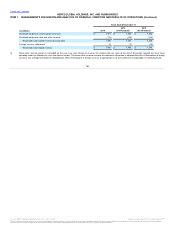
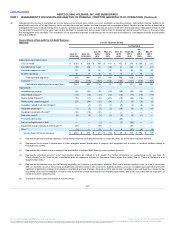
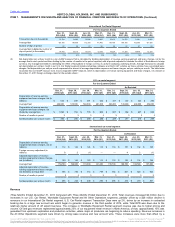
management uses internally. The contribution of our reportable segments to adjusted pre-tax income and reconciliation to consolidated amounts are presented below:
Adjusted pre-tax income (loss):
U.S. car rental $ 387
$ 1,033
$ 813
International car rental 144
134
83
Worldwide equipment rental 258
301
216
All other operations 62
58
47
Total reportable segments 851
1,526
1,159
Corporate(1) (448)
(430)
(343)
Consolidated adjusted pre-tax income 403
1,096
816
Adjustments:
Acquisition accounting(2) (132)
(132)
(110)
Debt-related charges(3) (53)
(68)
(84)
Restructuring charges (4) (56)
(77)
(38)
Restructuring related charges(5) (103)
(22)
(11)
Acquisition related costs and charges(6) (10)
(19)
(164)
Integration expenses(7) (9)
(43)
—
Equipment rental spin-off costs(8) (39)
—
—
Relocation costs(9) (9)
(7)
—
Premiums paid on debt(10) —
(29)
—
Loss on extinguishment of debt(11) (1)
(35)
—
Impairment charges and asset write-downs(12) (34)
(40)
—
Other(13) 20
(21)
(44)
Income (loss) before income taxes $ (23)
$ 603
$ 365
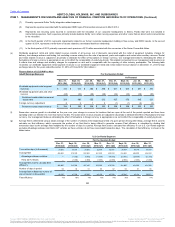
(1) Represents general corporate expenses, certain interest expense (including net interest on corporate debt), as well as other business activities.
(2) Represents the increase in amortization of other intangible assets, depreciation of property and equipment and accretion of revalued liabilities relating to
acquisition accounting.
(3) Represents debt-related charges relating to the amortization of deferred debt financing costs and debt discounts.
(4) Represents expenses incurred under restructuring actions as defined in U.S. GAAP. For further information on restructuring costs, see Note 15
"Restructuring," to the Notes to our consolidated financial statements included in this Annual Report under the caption Item 8, "Financial Statements and
Supplementary Data."
(5) Represents incremental costs incurred directly supporting our business transformation initiatives. Such costs include transition costs incurred in connection
with our business process outsourcing arrangements and incremental costs incurred to facilitate business process re-engineering initiatives that involve
significant organization redesign and extensive operational process changes. Amount in 2014 also includes consulting costs and legal fees related to the
accounting review and investigation, one-time costs to terminate certain marketing and co-branding agreements, and costs associated with the separation of
certain executives during the year.
(6) In 2012, primarily represents Dollar Thrifty acquisition related expenses, change in control expenses, 'Day-1' compensation expenses and other adjustments
related to the Dollar Thrifty acquisition, loss on the Advantage divestiture, expenses related to additional required divestitures and costs associated with the
Dollar Thrifty acquisition, pre-acquisition interest and commitment fee expenses for interim financing associated with the Dollar Thrifty acquisition and a gain on
the investment in Dollar Thrifty stock.
(7) Primarily represents Dollar Thrifty integration related expenses.
(8) Represents expense associated with the anticipated HERC spin-off transaction of which $28 million were incurred by HERC and $11 million were incurred by
Corporate.
(9) Represents non-recurring costs incurred in connection with the relocation of our corporate headquarters to Estero, Florida that were not included in
restructuring expenses. Such expenses primarily include duplicate facility rent, certain moving expenses, and other costs that are direct and incremental due
to the relocation.
53
Source: HERTZ GLOBAL HOLDINGS INC, 10-K, July 16, 2015 Powered by Morningstar® Document Research℠
The information contained herein may not be copied, adapted or distributed and is not warranted to be accurate, complete or timely. The user assumes all risks for any damages or losses arising from any use of this information,
except to the extent such damages or losses cannot be limited or excluded by applicable law. Past financial performance is no guarantee of future results.