Hertz 2014 Annual Report Download - page 75
Download and view the complete annual report
Please find page 75 of the 2014 Hertz annual report below. You can navigate through the pages in the report by either clicking on the pages listed below, or by using the keyword search tool below to find specific information within the annual report.-
 1
1 -
2
-
3
-
4
-
5
-
6
-
7
-
8
-
9
-
10
-
11
-
12
-
13
-
14
-
15
-
16
-
17
-
18
-
19
-
20
-
21
-
22
-
23
-
24
-
25
-
26
-
27
-
28
-
29
-
30
-
31
-
32
-
33
-
34
-
35
-
36
-
37
-
38
-
39
-
40
-
41
-
42
-
43
-
44
-
45
-
46
-
47
-
48
-
49
-
50
-
51
-
52
-
53
-
54
-
55
-
56
-
57
-
58
-
59
-
60
-
61
-
62
-
63
-
64
-
 65
65 -
 66
66 -
 67
67 -
 68
68 -
 69
69 -
 70
70 -
 71
71 -
 72
72 -
 73
73 -
 74
74 -
 75
75 -
 76
76 -
 77
77 -
 78
78 -
 79
79 -
 80
80 -
 81
81 -
 82
82 -
 83
83 -
 84
84 -
 85
85 -
86
-
87
-
88
-
89
-
90
-
91
-
92
-
93
-
94
-
95
-
96
-
97
-
98
-
99
-
100
-
101
-
102
-
103
-
104
-
105
-
106
-
107
-
108
-
109
-
110
-
111
-
112
-
113
-
114
-
115
-
116
-
117
-
118
-
119
-
120
-
121
-
122
-
123
-
124
-
125
-
126
-
127
-
128
-
129
-
130
-
131
-
132
-
133
-
134
-
135
-
136
-
137
-
138
-
139
-
140
-
141
-
142
-
143
-
144
-
145
-
146
-
147
-
148
-
149
-
150
-
151
-
152
-
153
-
154
-
155
-
156
-
157
-
158
-
159
-
160
-
161
-
162
-
163
-
164
-
165
-
166
-
167
-
168
-
169
-
170
-
171
-
172
-
173
-
174
-
175
-
176
-
177
-
178
-
179
-
180
-
181
-
182
-
183
-
184
-
185
-
186
-
187
-
188
-
189
-
190
-
191
-
192
-
193
-
194
-
195
-
196
-
197
-
198
-
199
-
200
-
201
-
202
-
203
-
204
-
205
-
206
-
207
-
208
-
209
-
210
-
211
-
212
-
213
-
214
-
215
-
216
-
217
-
218
-
219
-
220
-
221
-
222
-
223
-
224
-
225
-
226
-
227
-
228
-
229
-
230
-
231
-
232
-
233
-
234
-
235
-
236
-
237
-
238
-
239
-
240
-
241
-
242
-
243
-
244
-
245
-
246
-
247
-
248
-
249
-
250
-
251
-
252
-
253
-
254
-
255
-
256
-
257
-
258
-
259
-
260
-
261
-
262
-
263
-
264
-
265
-
266
-
267
-
268
-
269
-
270
-
271
-
272
-
273
-
274
-
275
-
276
-
277
-
278
-
279
-
280
-
281
-
282
-
283
-
284
-
285
-
286
-
287
-
288
-
289
-
290
-
291
-
292
-
293
-
294
-
295
-
296
-
297
-
298
-
299
-
300
-
301
-
302
-
303
-
304
-
305
-
306
-
307
-
308
-
309
-
310
-
311
-
312
-
313
-
314
-
315
-
316
-
317
-
318
-
319
-
320
-
321
-
322
-
323
-
324
-
325
-
326
-
327
-
328
-
329
-
330
-
331
-
332
-
333
-
334
-
335
-
336
-
337
-
338
-
339
-
340
-
341
-
342
-
343
-
344
-
345
-
346
-
347
-
348
-
349
-
350
-
351
-
352
-
353
-
354
-
355
-
356
-
357
-
358
-
359
-
360
-
361
-
362
-
363
-
364
-
365
-
366
-
367
-
368
-
369
-
370
-
371
-
372
-
373
-
374
-
375
-
376
-
377
-
378
-
379
-
380
-
381
-
382
-
383
-
384
-
385
-
386
 |
 |

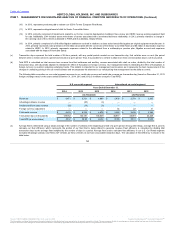
decrease in the International Car Rental segment due to the $37 million negative impact of foreign currency when compared with the 2013 fourth
quarter. Excluding currency effects, International Car Rental segment revenues were up 2% due to the incremental growth in the value segment as
we continue to expand our value brands.
Total revenues increased $46 million, or 1%,
due mainly to increases in our International Car Rental and Worldwide Equipment Rental segments as well as an increase in revenues generated
by Donlen. Higher revenues in our International Car Rental segment was largely driven by strong performance in Europe, which represented about
74% of revenues for the segment, due to the expansion of our value brands, and an increase in airport revenue in the Asia Pacific market.
Increases in our Worldwide Equipment Rental segment and Donlen were the result of increased volume. Total U.S. Car Rental segment revenue
was in line with the 2013 third quarter as a substantial increase in contracted bookings due to a large new account win was offset by our decision
to strategically reduce our consumer bookings from opaque travel web sites.
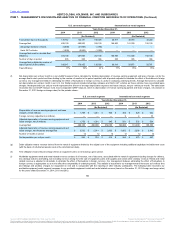
Total revenues increased $122 million, or 5%, due to
increases in revenues of all four segments. Higher revenues in our U.S. Car Rental segment were attributable to more transaction days driven by
14% growth in the off airport market. Total RPD growth was tempered by the higher percentage of off airport rentals driven by an increase in the
number of replacement renters during the period. In our International Car Rental segment, Europe’s revenue grew 5% as compared to the prior-year
period, excluding currency, primarily driven by the expansion of our value brands. Also, we experienced strong revenue growth in the Asia Pacific
market. Although revenues increased in our Worldwide Equipment Rental segment, unfavorable mix comparisons in certain industrial verticals
caused a slowdown in revenue growth. Revenue increases in the All Other Operations segment are due to Donlen leasing operations which
experienced increased volume.
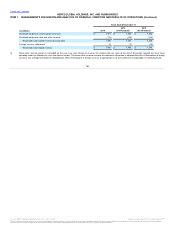
Total revenues increased $99 million, or 4%, due to a
$73 million increase in our U.S. Car Rental segment revenues coupled with modest increases in the revenues of our remaining segments. The
increase in U.S. Car Rental was driven by a 17% increase in off airport transaction days due to our off airport expansion. International Car Rental
segment revenues increased approximately 2% over the same period last year driven by Europe’s top line improvement as we opened 12 new off
airport locations, generated incremental Firefly revenue, launched our Dream Car collection in five countries and had increased ancillary sales.
Worldwide Equipment Rental segment revenues increased approximately 1% over the same period last year primarily driven by increases in
volume and pricing in our North America locations. Our Donlen leasing operation’s revenue results benefited from strong lease revenue and new
account wins.
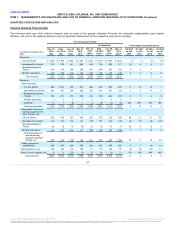
Increases in direct operating expenses of $126
million, or 9%, were primarily comprised of increases in our U.S. Car Rental and World Wide Equipment Rental segments of $94 million and $18
million, respectively.
• For the U.S. Car Rental segment, increases were attributable to higher maintenance and damage expense of $47 million. Higher
maintenance and damage costs were driven by the age of our fleet, the level of recall activity, the increase in our off airport business mix
and the incremental expense associated with preparing more than 80,000 vehicles for sale or return to the manufacturer as part of our fleet
refresh. Liability and third
63
Source: HERTZ GLOBAL HOLDINGS INC, 10-K, July 16, 2015 Powered by Morningstar® Document Research℠
The information contained herein may not be copied, adapted or distributed and is not warranted to be accurate, complete or timely. The user assumes all risks for any damages or losses arising from any use of this information,
except to the extent such damages or losses cannot be limited or excluded by applicable law. Past financial performance is no guarantee of future results.