Hertz 2014 Annual Report Download - page 66
Download and view the complete annual report
Please find page 66 of the 2014 Hertz annual report below. You can navigate through the pages in the report by either clicking on the pages listed below, or by using the keyword search tool below to find specific information within the annual report.-
 1
1 -
2
-
3
-
4
-
5
-
6
-
7
-
8
-
9
-
10
-
11
-
12
-
13
-
14
-
15
-
16
-
17
-
18
-
19
-
20
-
21
-
22
-
23
-
24
-
25
-
26
-
27
-
28
-
29
-
30
-
31
-
32
-
33
-
34
-
35
-
36
-
37
-
38
-
39
-
40
-
41
-
42
-
43
-
44
-
45
-
46
-
47
-
48
-
49
-
50
-
51
-
52
-
53
-
54
-
55
-
 56
56 -
 57
57 -
 58
58 -
 59
59 -
 60
60 -
 61
61 -
 62
62 -
 63
63 -
 64
64 -
 65
65 -
 66
66 -
 67
67 -
 68
68 -
 69
69 -
 70
70 -
 71
71 -
 72
72 -
 73
73 -
 74
74 -
 75
75 -
 76
76 -
77
-
78
-
79
-
80
-
81
-
82
-
83
-
84
-
85
-
86
-
87
-
88
-
89
-
90
-
91
-
92
-
93
-
94
-
95
-
96
-
97
-
98
-
99
-
100
-
101
-
102
-
103
-
104
-
105
-
106
-
107
-
108
-
109
-
110
-
111
-
112
-
113
-
114
-
115
-
116
-
117
-
118
-
119
-
120
-
121
-
122
-
123
-
124
-
125
-
126
-
127
-
128
-
129
-
130
-
131
-
132
-
133
-
134
-
135
-
136
-
137
-
138
-
139
-
140
-
141
-
142
-
143
-
144
-
145
-
146
-
147
-
148
-
149
-
150
-
151
-
152
-
153
-
154
-
155
-
156
-
157
-
158
-
159
-
160
-
161
-
162
-
163
-
164
-
165
-
166
-
167
-
168
-
169
-
170
-
171
-
172
-
173
-
174
-
175
-
176
-
177
-
178
-
179
-
180
-
181
-
182
-
183
-
184
-
185
-
186
-
187
-
188
-
189
-
190
-
191
-
192
-
193
-
194
-
195
-
196
-
197
-
198
-
199
-
200
-
201
-
202
-
203
-
204
-
205
-
206
-
207
-
208
-
209
-
210
-
211
-
212
-
213
-
214
-
215
-
216
-
217
-
218
-
219
-
220
-
221
-
222
-
223
-
224
-
225
-
226
-
227
-
228
-
229
-
230
-
231
-
232
-
233
-
234
-
235
-
236
-
237
-
238
-
239
-
240
-
241
-
242
-
243
-
244
-
245
-
246
-
247
-
248
-
249
-
250
-
251
-
252
-
253
-
254
-
255
-
256
-
257
-
258
-
259
-
260
-
261
-
262
-
263
-
264
-
265
-
266
-
267
-
268
-
269
-
270
-
271
-
272
-
273
-
274
-
275
-
276
-
277
-
278
-
279
-
280
-
281
-
282
-
283
-
284
-
285
-
286
-
287
-
288
-
289
-
290
-
291
-
292
-
293
-
294
-
295
-
296
-
297
-
298
-
299
-
300
-
301
-
302
-
303
-
304
-
305
-
306
-
307
-
308
-
309
-
310
-
311
-
312
-
313
-
314
-
315
-
316
-
317
-
318
-
319
-
320
-
321
-
322
-
323
-
324
-
325
-
326
-
327
-
328
-
329
-
330
-
331
-
332
-
333
-
334
-
335
-
336
-
337
-
338
-
339
-
340
-
341
-
342
-
343
-
344
-
345
-
346
-
347
-
348
-
349
-
350
-
351
-
352
-
353
-
354
-
355
-
356
-
357
-
358
-
359
-
360
-
361
-
362
-
363
-
364
-
365
-
366
-
367
-
368
-
369
-
370
-
371
-
372
-
373
-
374
-
375
-
376
-
377
-
378
-
379
-
380
-
381
-
382
-
383
-
384
-
385
-
386
 |
 |

Table of Contents
Transaction days (in thousands) 139,752
133,181
105,539
46,917
45,019
43,248
Average fleet 499,100
490,000
359,100
166,900
161,300
155,100
Advantage Sublease vehicles (4,000)
(21,000)
(1,000)
—
—
—
Hertz 24/7 vehicles (1,000)
(2,000)
(1,000)
—
—
—
Average fleet used to calculate fleet
efficiency 494,100
467,000
357,100
166,900
161,300
155,100
Number of days in period 365
365
366
365
365
366
Average fleet multiplied by number of
days in period (in thousands) 180,347
170,455
130,699
60,919
58,875
56,767
Fleet efficiency 77%
78%
81%
77%
76%
76%
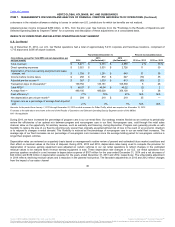
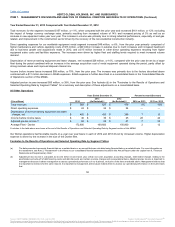
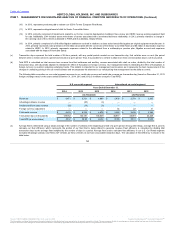
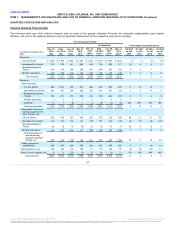
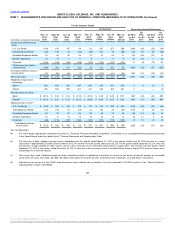
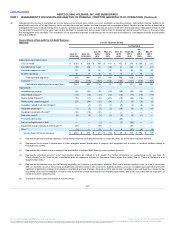
(f) Net depreciation per unit per month is a non-GAAP measure that is calculated by dividing depreciation of revenue earning equipment and lease charges, net by the
average fleet in each period and then dividing by the number of months in the period reported, with all periods adjusted to eliminate the effect of fluctuations in foreign
currency. Our management believes eliminating the effect of fluctuations in foreign currency is useful in analyzing underlying trends. Average fleet used to calculate
net depreciation per unit per month in our U.S. Car Rental segment includes Advantage sublease and Hertz 24/7 vehicles as these vehicles have associated lease
charges. Net depreciation per unit per month represents the amount of average depreciation expense and lease charges, net per vehicle per month. The table below
reconciles this non-GAAP measure to its most comparable GAAP measure, which is depreciation of revenue earning equipment and lease charges, net, (based on
December 31, 2013 foreign exchange rates) for the periods shown:
Depreciation of revenue earning equipment and lease
charges, net (in millions) $ 1,758
$ 1,281
$ 945
$ 492
$ 528
$ 524
Foreign currency adjustment (in millions) —
—
—
9
4
10
Adjusted depreciation of revenue earning equipment and
lease charges, net (in millions) $ 1,758
$ 1,281
$ 945
$ 501
$ 532
$ 534
Average fleet 499,100
490,000
359,100
166,900
161,300
155,100
Adjusted depreciation of revenue earning equipment and
lease charges, net divided by average fleet $ 3,522
$ 2,614
$ 2,632
$ 3,002
$ 3,298
$ 3,443
Number of months in period 12
12
12
12
12
12
Net depreciation per unit per month $ 294 $ 218 $ 219
$ 250 $ 275 $ 287
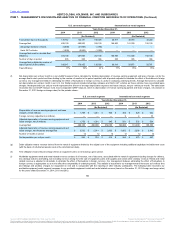
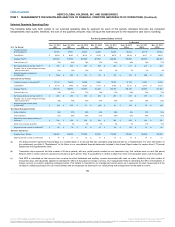
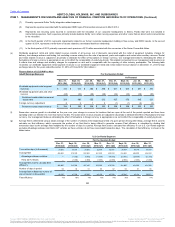
(g) Dollar utilization means revenue derived from the rental of equipment divided by the original cost of the equipment including additional capitalized refurbishment costs
(with the basis of refurbished assets reset at the refurbishment date).
(h) Time Utilization means the percentage of time an equipment unit is on-rent during a given period.
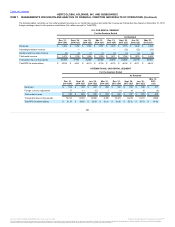
(i) Worldwide equipment rental and rental related revenue consists of all revenue, net of discounts, associated with the rental of equipment including charges for delivery,
loss damage waivers and fueling, but excluding revenue arising from the sale of equipment, parts and supplies and certain other ancillary revenue. Rental and rental
related revenue is adjusted in all periods to eliminate the effect of fluctuations in foreign currency. Our management believes eliminating the effect of fluctuations in
foreign currency is appropriate so as not to affect the comparability of underlying trends. This statistic is important to our management and investors as it reflects time
and mileage and ancillary charges for equipment on rent and is comparable with the reporting of other industry participants. The following table reconciles our
worldwide equipment rental segment revenues to our worldwide equipment rental and rental related revenue (based on December 31, 2013 foreign exchange rates)
for the years ended December 31, 2014, 2013 and 2012:
55
Source: HERTZ GLOBAL HOLDINGS INC, 10-K, July 16, 2015 Powered by Morningstar® Document Research℠
The information contained herein may not be copied, adapted or distributed and is not warranted to be accurate, complete or timely. The user assumes all risks for any damages or losses arising from any use of this information,
except to the extent such damages or losses cannot be limited or excluded by applicable law. Past financial performance is no guarantee of future results.