Hertz 2014 Annual Report Download - page 76
Download and view the complete annual report
Please find page 76 of the 2014 Hertz annual report below. You can navigate through the pages in the report by either clicking on the pages listed below, or by using the keyword search tool below to find specific information within the annual report.-
 1
1 -
2
-
3
-
4
-
5
-
6
-
7
-
8
-
9
-
10
-
11
-
12
-
13
-
14
-
15
-
16
-
17
-
18
-
19
-
20
-
21
-
22
-
23
-
24
-
25
-
26
-
27
-
28
-
29
-
30
-
31
-
32
-
33
-
34
-
35
-
36
-
37
-
38
-
39
-
40
-
41
-
42
-
43
-
44
-
45
-
46
-
47
-
48
-
49
-
50
-
51
-
52
-
53
-
54
-
55
-
56
-
57
-
58
-
59
-
60
-
61
-
62
-
63
-
64
-
65
-
 66
66 -
 67
67 -
 68
68 -
 69
69 -
 70
70 -
 71
71 -
 72
72 -
 73
73 -
 74
74 -
 75
75 -
 76
76 -
 77
77 -
 78
78 -
 79
79 -
 80
80 -
 81
81 -
 82
82 -
 83
83 -
 84
84 -
 85
85 -
 86
86 -
87
-
88
-
89
-
90
-
91
-
92
-
93
-
94
-
95
-
96
-
97
-
98
-
99
-
100
-
101
-
102
-
103
-
104
-
105
-
106
-
107
-
108
-
109
-
110
-
111
-
112
-
113
-
114
-
115
-
116
-
117
-
118
-
119
-
120
-
121
-
122
-
123
-
124
-
125
-
126
-
127
-
128
-
129
-
130
-
131
-
132
-
133
-
134
-
135
-
136
-
137
-
138
-
139
-
140
-
141
-
142
-
143
-
144
-
145
-
146
-
147
-
148
-
149
-
150
-
151
-
152
-
153
-
154
-
155
-
156
-
157
-
158
-
159
-
160
-
161
-
162
-
163
-
164
-
165
-
166
-
167
-
168
-
169
-
170
-
171
-
172
-
173
-
174
-
175
-
176
-
177
-
178
-
179
-
180
-
181
-
182
-
183
-
184
-
185
-
186
-
187
-
188
-
189
-
190
-
191
-
192
-
193
-
194
-
195
-
196
-
197
-
198
-
199
-
200
-
201
-
202
-
203
-
204
-
205
-
206
-
207
-
208
-
209
-
210
-
211
-
212
-
213
-
214
-
215
-
216
-
217
-
218
-
219
-
220
-
221
-
222
-
223
-
224
-
225
-
226
-
227
-
228
-
229
-
230
-
231
-
232
-
233
-
234
-
235
-
236
-
237
-
238
-
239
-
240
-
241
-
242
-
243
-
244
-
245
-
246
-
247
-
248
-
249
-
250
-
251
-
252
-
253
-
254
-
255
-
256
-
257
-
258
-
259
-
260
-
261
-
262
-
263
-
264
-
265
-
266
-
267
-
268
-
269
-
270
-
271
-
272
-
273
-
274
-
275
-
276
-
277
-
278
-
279
-
280
-
281
-
282
-
283
-
284
-
285
-
286
-
287
-
288
-
289
-
290
-
291
-
292
-
293
-
294
-
295
-
296
-
297
-
298
-
299
-
300
-
301
-
302
-
303
-
304
-
305
-
306
-
307
-
308
-
309
-
310
-
311
-
312
-
313
-
314
-
315
-
316
-
317
-
318
-
319
-
320
-
321
-
322
-
323
-
324
-
325
-
326
-
327
-
328
-
329
-
330
-
331
-
332
-
333
-
334
-
335
-
336
-
337
-
338
-
339
-
340
-
341
-
342
-
343
-
344
-
345
-
346
-
347
-
348
-
349
-
350
-
351
-
352
-
353
-
354
-
355
-
356
-
357
-
358
-
359
-
360
-
361
-
362
-
363
-
364
-
365
-
366
-
367
-
368
-
369
-
370
-
371
-
372
-
373
-
374
-
375
-
376
-
377
-
378
-
379
-
380
-
381
-
382
-
383
-
384
-
385
-
386
 |
 |

Table of Contents
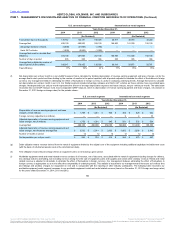
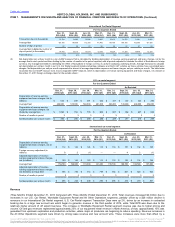
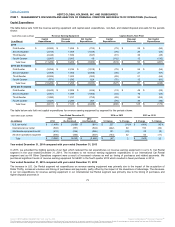
party property damage expense ("PLPD") increased $9 million due to the off airport growth and adjustments for experience rates.
Personnel related expenses increased $13 million, or 5%, from 2013, primarily driven by an increase in maintenance personnel to support
an initiative to decrease down time of the aged fleet and increased recalls. In addition, annual merit and labor contract pay increases were
a component of the overall personnel related expense increase. Other direct operating expenses increased $28 million, or 7%, from 2013
and is primarily comprised of increases in reservations expense due to the growth in the number of off airport locations, restructuring costs
associated with our business transformation initiative and customer service expenses which are partially attributable to a change in
contract terms with a certain service provider during the year and additional bad debt provision expense due to an increase in write-off
experience rates.
• Increases in our Worldwide Equipment Rental segment included additional costs to repair equipment in the fleet to reduce fleet unavailable
for rent ("FUR"), a second half 2014 initiative.
Increases in direct operating expenses of
$155 million, or 10%, were primarily comprised of increases in our U.S. and International Car Rental segments of $108 million and $16 million,
respectively and an increase of $15 million in our Worldwide Equipment Rental segment.
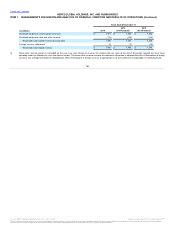
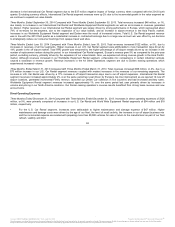
• For the U.S. Car Rental segment increases were attributable to higher maintenance and damage expenses of $33 million due the average
age of the U.S. fleet, the level of recall activity and an increase in the off airport transaction day mix. Additionally, there was a $54 million
increase in other direct operating expenses comprised of field administration and facilities expenses resulting from the off airport
expansion, an increase in restructuring costs of $21 million due to impairments, business transformation and integration initiatives and
higher customer service expenses due in part to a change in contract terms with a certain service provider during the year.
• Direct operating expenses for our International Car Rental segment increased due mainly to a $14 million increase in other direct operating
expenses driven by increased commission expenses and facilities expenses which were impacted by standard rent increases.
• Increases in our Worldwide Equipment Rental segment included additional costs to repair equipment in the fleet to reduce FUR, a second
half 2014 initiative.
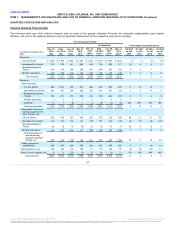
Increases in direct operating expenses of $177 million, or
12%, were primarily comprised of increases in our U.S. and International Car Rental segments of $125 million and $47 million, respectively.
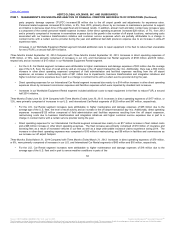
• For the U.S. Car Rental segment increases were attributable to higher maintenance and damage expenses of $35 million due to the
average age of the U.S. fleet, the level of recall activity and an increase in the off airport transaction day mix. Additionally, direct operating
expenses increased $125 million comprised of field administration and facilities expenses resulting from the off airport expansion,
restructuring costs due to business transformation and integration initiatives and higher customer service expenses due in part to a
change in contract terms with a certain service provider during the year.
• Direct operating expenses for our International Car Rental segment increased due mainly to an $17 million increase in fleet related costs
and a $28 million increase in other direct operating expenses. The fleet increase was primarily comprised of $10 million of insurance and
licensing fees as a result of increased vehicles in our fleet as well as a large unfavorable insurance claims experience during 2014. The
increase in other direct operating expenses was comprised of $10 million in restructuring, and $9 million in facilities and commissions as
we increase our off airport footprint.
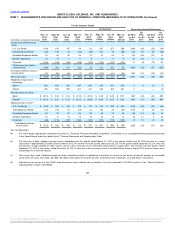
Increases in direct operating expenses of $79 million,
or 6%, were primarily comprised of increases in our U.S. and International Car Rental segments of $60 million and $16 million, respectively.
• For the U.S. Car Rental segment increases were attributable to higher maintenance and damage expenses of $18 million due to the
average age of the U.S. fleet and in part to severe weather conditions in parts of the
64
Source: HERTZ GLOBAL HOLDINGS INC, 10-K, July 16, 2015 Powered by Morningstar® Document Research℠
The information contained herein may not be copied, adapted or distributed and is not warranted to be accurate, complete or timely. The user assumes all risks for any damages or losses arising from any use of this information,
except to the extent such damages or losses cannot be limited or excluded by applicable law. Past financial performance is no guarantee of future results.