Hertz 2014 Annual Report Download - page 69
Download and view the complete annual report
Please find page 69 of the 2014 Hertz annual report below. You can navigate through the pages in the report by either clicking on the pages listed below, or by using the keyword search tool below to find specific information within the annual report.-
 1
1 -
2
-
3
-
4
-
5
-
6
-
7
-
8
-
9
-
10
-
11
-
12
-
13
-
14
-
15
-
16
-
17
-
18
-
19
-
20
-
21
-
22
-
23
-
24
-
25
-
26
-
27
-
28
-
29
-
30
-
31
-
32
-
33
-
34
-
35
-
36
-
37
-
38
-
39
-
40
-
41
-
42
-
43
-
44
-
45
-
46
-
47
-
48
-
49
-
50
-
51
-
52
-
53
-
54
-
55
-
56
-
57
-
58
-
 59
59 -
 60
60 -
 61
61 -
 62
62 -
 63
63 -
 64
64 -
 65
65 -
 66
66 -
 67
67 -
 68
68 -
 69
69 -
 70
70 -
 71
71 -
 72
72 -
 73
73 -
 74
74 -
 75
75 -
 76
76 -
 77
77 -
 78
78 -
 79
79 -
80
-
81
-
82
-
83
-
84
-
85
-
86
-
87
-
88
-
89
-
90
-
91
-
92
-
93
-
94
-
95
-
96
-
97
-
98
-
99
-
100
-
101
-
102
-
103
-
104
-
105
-
106
-
107
-
108
-
109
-
110
-
111
-
112
-
113
-
114
-
115
-
116
-
117
-
118
-
119
-
120
-
121
-
122
-
123
-
124
-
125
-
126
-
127
-
128
-
129
-
130
-
131
-
132
-
133
-
134
-
135
-
136
-
137
-
138
-
139
-
140
-
141
-
142
-
143
-
144
-
145
-
146
-
147
-
148
-
149
-
150
-
151
-
152
-
153
-
154
-
155
-
156
-
157
-
158
-
159
-
160
-
161
-
162
-
163
-
164
-
165
-
166
-
167
-
168
-
169
-
170
-
171
-
172
-
173
-
174
-
175
-
176
-
177
-
178
-
179
-
180
-
181
-
182
-
183
-
184
-
185
-
186
-
187
-
188
-
189
-
190
-
191
-
192
-
193
-
194
-
195
-
196
-
197
-
198
-
199
-
200
-
201
-
202
-
203
-
204
-
205
-
206
-
207
-
208
-
209
-
210
-
211
-
212
-
213
-
214
-
215
-
216
-
217
-
218
-
219
-
220
-
221
-
222
-
223
-
224
-
225
-
226
-
227
-
228
-
229
-
230
-
231
-
232
-
233
-
234
-
235
-
236
-
237
-
238
-
239
-
240
-
241
-
242
-
243
-
244
-
245
-
246
-
247
-
248
-
249
-
250
-
251
-
252
-
253
-
254
-
255
-
256
-
257
-
258
-
259
-
260
-
261
-
262
-
263
-
264
-
265
-
266
-
267
-
268
-
269
-
270
-
271
-
272
-
273
-
274
-
275
-
276
-
277
-
278
-
279
-
280
-
281
-
282
-
283
-
284
-
285
-
286
-
287
-
288
-
289
-
290
-
291
-
292
-
293
-
294
-
295
-
296
-
297
-
298
-
299
-
300
-
301
-
302
-
303
-
304
-
305
-
306
-
307
-
308
-
309
-
310
-
311
-
312
-
313
-
314
-
315
-
316
-
317
-
318
-
319
-
320
-
321
-
322
-
323
-
324
-
325
-
326
-
327
-
328
-
329
-
330
-
331
-
332
-
333
-
334
-
335
-
336
-
337
-
338
-
339
-
340
-
341
-
342
-
343
-
344
-
345
-
346
-
347
-
348
-
349
-
350
-
351
-
352
-
353
-
354
-
355
-
356
-
357
-
358
-
359
-
360
-
361
-
362
-
363
-
364
-
365
-
366
-
367
-
368
-
369
-
370
-
371
-
372
-
373
-
374
-
375
-
376
-
377
-
378
-
379
-
380
-
381
-
382
-
383
-
384
-
385
-
386
 |
 |

Table of Contents
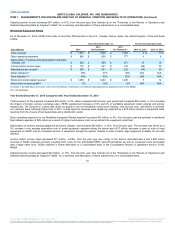
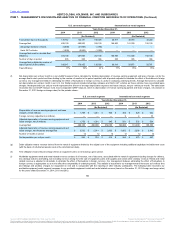
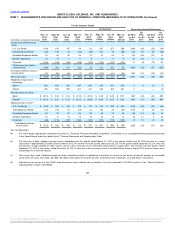
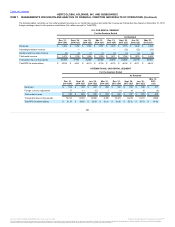
Income (loss) before Income
taxes:
U.S. Car Rental (164)
160
167
94
112
297
257
204
(246)
(46)
(35)
(54)
International Car Rental (22)
130
32
(45)
(29)
101
19
(58)
(24)
29
68
(22)
Worldwide Equipment Rental 30
56
49
36
70
76
62
31
(57)
(26)
(21)
16
All Other Operations 12
13
11
11
9
7
11
9
33
86
—
22
Corporate (140)
(156)
(138)
(158)
(123)
(169)
(157)
(127)
14
(8)
(12)
24
Total income (loss) before
income taxes (284)
203
121
(62)
39
312
192
59
(828)
(35)
(37)
(205)
(Provision) benefit for taxes on
income (loss) 50
(54)
(49)
(7)
(57)
(110)
(81)
(53)
NM
(51)
(40)
(87)
Net income (loss) $ (234)
$ 149
$ 72
$ (69)
$ (18)
$ 202
$ 111
$ 6
1,200
(26)
(35)
NM
Weighted average shares
outstanding:
Basic (b) 459
459
452
447
447
425
401
416
3
8
13
7
Diluted 459
464
465
447
447
465
465
461
3
—
—
(3)
Earnings (loss) per share:
Basic $ (0.51)
$ 0.32
$ 0.16
$ (0.15)
$ (0.04)
$ 0.48
$ 0.28
$ 0.01
NM
(33)
(43)
NM
Diluted(c) $ (0.51)
$ 0.32
$ 0.15
$ (0.15)
$ (0.04)
$ 0.44
$ 0.25
$ 0.02
NM
(27)
(40)
NM
Adjusted pre-tax income(d):
U.S. Car Rental $ (126)
$ 209
$ 184
$ 119
$ 132
$ 379
$ 289
$ 232
(195)
(45)
(36)
(49)
International Car Rental (12)
136
57
(39)
21
126
35
(47)
(157)
8
63
(17)
Worldwide Equipment Rental 60
79
67
52
93
89
73
45
(35)
(11)
(8)
16
All Other Operations 15
17
15
16
16
14
14
13
(6)
21
7
23
Corporate (98)
(119)
(107)
(124)
(105)
(101)
(115)
(107)
(7)
18
(7)
16
Total adjusted pre-tax
income (loss) $ (161)
$ 322
$ 216
$ 24
$ 157
$ 507
$ 296
$ 136
(203)
(36)
(27)
(82)
(a) For further details regarding the restatement see Note 21Quarterly Financial Information (Unaudited)"to the Notes to our consolidated financial statements included
in this Annual Report under the caption Item 8, "Financial Statements and Supplementary Data."
(b) The decrease in basic weighted average shares outstanding from the quarter ended March 31, 2013 to the quarter ended June 30, 2013 was due to a share
repurchase of approximately 23 million shares in March 2013. The increase from the quarter ended June 30, 2013 to the quarter ended September 30, 2013 was due
the issuance of approximately 47 million shares due to to the conversion of the Convertible Senior Notes in August 2013. The increase from the quarter ended
September 30, 2013 to the quarter ended December 30, 2013 is also due to the conversion of the Convertible Senior Notes in August 2013 as those shares were
outstanding for the full fourth quarter.
(c) Net income (loss) used in diluted earnings per share calculation includes an adjustment to add back to net income the amount of interest expense on convertible
senior notes, net of tax of $1 million, $2 million, $4 million and $1 million for the 2013 quarters ended December, September, June and March, respectively.
(d) Adjusted pre-tax income is a Non-GAAP financial measure that is defined and reconciled to its most comparable U.S.GAAP measure in the "Selected Quarterly
Operating Data" section of this MD&A.
58
Source: HERTZ GLOBAL HOLDINGS INC, 10-K, July 16, 2015 Powered by Morningstar® Document Research℠
The information contained herein may not be copied, adapted or distributed and is not warranted to be accurate, complete or timely. The user assumes all risks for any damages or losses arising from any use of this information,
except to the extent such damages or losses cannot be limited or excluded by applicable law. Past financial performance is no guarantee of future results.