Hertz 2014 Annual Report Download - page 244
Download and view the complete annual report
Please find page 244 of the 2014 Hertz annual report below. You can navigate through the pages in the report by either clicking on the pages listed below, or by using the keyword search tool below to find specific information within the annual report.-
 1
1 -
2
-
3
-
4
-
5
-
6
-
7
-
8
-
9
-
10
-
11
-
12
-
13
-
14
-
15
-
16
-
17
-
18
-
19
-
20
-
21
-
22
-
23
-
24
-
25
-
26
-
27
-
28
-
29
-
30
-
31
-
32
-
33
-
34
-
35
-
36
-
37
-
38
-
39
-
40
-
41
-
42
-
43
-
44
-
45
-
46
-
47
-
48
-
49
-
50
-
51
-
52
-
53
-
54
-
55
-
56
-
57
-
58
-
59
-
60
-
61
-
62
-
63
-
64
-
65
-
66
-
67
-
68
-
69
-
70
-
71
-
72
-
73
-
74
-
75
-
76
-
77
-
78
-
79
-
80
-
81
-
82
-
83
-
84
-
85
-
86
-
87
-
88
-
89
-
90
-
91
-
92
-
93
-
94
-
95
-
96
-
97
-
98
-
99
-
100
-
101
-
102
-
103
-
104
-
105
-
106
-
107
-
108
-
109
-
110
-
111
-
112
-
113
-
114
-
115
-
116
-
117
-
118
-
119
-
120
-
121
-
122
-
123
-
124
-
125
-
126
-
127
-
128
-
129
-
130
-
131
-
132
-
133
-
134
-
135
-
136
-
137
-
138
-
139
-
140
-
141
-
142
-
143
-
144
-
145
-
146
-
147
-
148
-
149
-
150
-
151
-
152
-
153
-
154
-
155
-
156
-
157
-
158
-
159
-
160
-
161
-
162
-
163
-
164
-
165
-
166
-
167
-
168
-
169
-
170
-
171
-
172
-
173
-
174
-
175
-
176
-
177
-
178
-
179
-
180
-
181
-
182
-
183
-
184
-
185
-
186
-
187
-
188
-
189
-
190
-
191
-
192
-
193
-
194
-
195
-
196
-
197
-
198
-
199
-
200
-
201
-
202
-
203
-
204
-
205
-
206
-
207
-
208
-
209
-
210
-
211
-
212
-
213
-
214
-
215
-
216
-
217
-
218
-
219
-
220
-
221
-
222
-
223
-
224
-
225
-
226
-
227
-
228
-
229
-
230
-
231
-
232
-
233
-
 234
234 -
 235
235 -
 236
236 -
 237
237 -
 238
238 -
 239
239 -
 240
240 -
 241
241 -
 242
242 -
 243
243 -
 244
244 -
 245
245 -
 246
246 -
 247
247 -
 248
248 -
 249
249 -
 250
250 -
 251
251 -
 252
252 -
 253
253 -
 254
254 -
255
-
256
-
257
-
258
-
259
-
260
-
261
-
262
-
263
-
264
-
265
-
266
-
267
-
268
-
269
-
270
-
271
-
272
-
273
-
274
-
275
-
276
-
277
-
278
-
279
-
280
-
281
-
282
-
283
-
284
-
285
-
286
-
287
-
288
-
289
-
290
-
291
-
292
-
293
-
294
-
295
-
296
-
297
-
298
-
299
-
300
-
301
-
302
-
303
-
304
-
305
-
306
-
307
-
308
-
309
-
310
-
311
-
312
-
313
-
314
-
315
-
316
-
317
-
318
-
319
-
320
-
321
-
322
-
323
-
324
-
325
-
326
-
327
-
328
-
329
-
330
-
331
-
332
-
333
-
334
-
335
-
336
-
337
-
338
-
339
-
340
-
341
-
342
-
343
-
344
-
345
-
346
-
347
-
348
-
349
-
350
-
351
-
352
-
353
-
354
-
355
-
356
-
357
-
358
-
359
-
360
-
361
-
362
-
363
-
364
-
365
-
366
-
367
-
368
-
369
-
370
-
371
-
372
-
373
-
374
-
375
-
376
-
377
-
378
-
379
-
380
-
381
-
382
-
383
-
384
-
385
-
386
 |
 |

Table of Contents
‑To earn target (100%) or higher awards for 2014 (the maximum award was
150% of target), corporate performance had to meet Corporate EBITDA targets that exceeded the 2014 Strategic Plan. Achieving 100% of the
Strategic Plan would only result in an 80% payout. Based on 2014 results, the NEOs could earn, or “lock‑in” the 2014 payout factor, but would
have a chance to improve upon their payout factor through meeting 2014‑2015 Corporate EBITDA performance goals.
‑‑To account for the heightened difficulty in achieving the 2014 targets, the plan
uses combined 2014‑2015 Corporate EBITDA goals to encourage our NEOs to increase our financial performance. For 2014‑2015, to earn target
(100%) awards, corporate performance must achieve 100% of the Corporate EBITDA target in the combined 2014‑2015 Strategic Plan. To earn the
maximum awards, the NEOs must achieve 100% of the Corporate EBITDA target in the combined 2014‑2015 Stretch Plan.
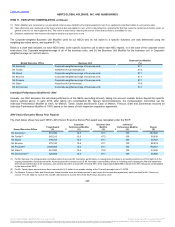
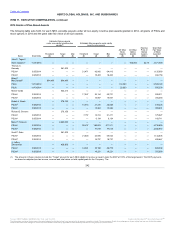
The amount of PSUs eligible to vest varies based upon actual performance as follows:
‑
Threshold
2,037.0
4,335.6
50% payout
(no payout below threshold)
Intermediate
2,263.3
4,624.6
80% payout
Target
2,379.5
4,817.3
100% payout
Maximum
2,829.1
5,064.6
150% payout
Straight line interpolation was used to determine the payout for Corporate EBITDA results that were between the various levels.
Actual Corporate EBITDA for 2014 was $1,331 million. This amount was below the threshold, resulting in the NEOs earning none of the PSUs
eligible to be earned for 2014. While the NEOs can potentially earn PSUs in 2015 for combined 2014-2015 Corporate EBITDA performance, it is
not expected that Corporate EBITDA performance in combined 2014-2015 will exceed the threshold performance level of $4,335.6 million, so the
NEOs will likely earn none of the PSUs granted in 2014. If earned for the 2014-2015 combined performance period, the PSUs would vest 662/3% in
2016 and 331/3% in 2017.
In 2014, the Compensation Committee continued its practice of granting 30% of the total PSUs with Corporate EBITDA margin as the performance
metric. The Compensation Committee believed that (i) awarding 30% of the total PSUs based on Corporate EBITDA margin provided appropriate
incentives to promote our Company’s performance and enhance retention of our NEOs and (ii) the use of Corporate EBITDA margin would
motivate our NEOs to increase our Company’s Corporate EBITDA (which forms the other 70% portion of our Company’s equity awards) in a
responsible and sustainable way.
To earn Corporate EBITDA margin PSUs, the NEOs needed to achieve a Corporate EBITDA margin level of at least 75% of the Corporate EBITDA
margin level in 2013 of 19.0%, or 14.25%. The Compensation Committee selected this goal in order to preserve a minimum level of financial
performance while encouraging the overall increase in Corporate EBITDA. If the Corporate EBITDA margin for 2014 equaled or exceeded 14.25%,
then the NEOs were eligible to earn the entire award. If the Corporate EBITDA margin for 2014 did not equal or exceed 14.25%, then the NEOs
would not earn any of the award. The Compensation Committee believed that this “all or nothing” framework reinforced our compensation
philosophy and provided appropriate incentives in light of the form and amount of the other equity awards granted in 2014.
232
Source: HERTZ GLOBAL HOLDINGS INC, 10-K, July 16, 2015 Powered by Morningstar® Document Research℠
The information contained herein may not be copied, adapted or distributed and is not warranted to be accurate, complete or timely. The user assumes all risks for any damages or losses arising from any use of this information,
except to the extent such damages or losses cannot be limited or excluded by applicable law. Past financial performance is no guarantee of future results.