Hertz 2014 Annual Report Download - page 68
Download and view the complete annual report
Please find page 68 of the 2014 Hertz annual report below. You can navigate through the pages in the report by either clicking on the pages listed below, or by using the keyword search tool below to find specific information within the annual report.-
 1
1 -
2
-
3
-
4
-
5
-
6
-
7
-
8
-
9
-
10
-
11
-
12
-
13
-
14
-
15
-
16
-
17
-
18
-
19
-
20
-
21
-
22
-
23
-
24
-
25
-
26
-
27
-
28
-
29
-
30
-
31
-
32
-
33
-
34
-
35
-
36
-
37
-
38
-
39
-
40
-
41
-
42
-
43
-
44
-
45
-
46
-
47
-
48
-
49
-
50
-
51
-
52
-
53
-
54
-
55
-
56
-
57
-
 58
58 -
 59
59 -
 60
60 -
 61
61 -
 62
62 -
 63
63 -
 64
64 -
 65
65 -
 66
66 -
 67
67 -
 68
68 -
 69
69 -
 70
70 -
 71
71 -
 72
72 -
 73
73 -
 74
74 -
 75
75 -
 76
76 -
 77
77 -
 78
78 -
79
-
80
-
81
-
82
-
83
-
84
-
85
-
86
-
87
-
88
-
89
-
90
-
91
-
92
-
93
-
94
-
95
-
96
-
97
-
98
-
99
-
100
-
101
-
102
-
103
-
104
-
105
-
106
-
107
-
108
-
109
-
110
-
111
-
112
-
113
-
114
-
115
-
116
-
117
-
118
-
119
-
120
-
121
-
122
-
123
-
124
-
125
-
126
-
127
-
128
-
129
-
130
-
131
-
132
-
133
-
134
-
135
-
136
-
137
-
138
-
139
-
140
-
141
-
142
-
143
-
144
-
145
-
146
-
147
-
148
-
149
-
150
-
151
-
152
-
153
-
154
-
155
-
156
-
157
-
158
-
159
-
160
-
161
-
162
-
163
-
164
-
165
-
166
-
167
-
168
-
169
-
170
-
171
-
172
-
173
-
174
-
175
-
176
-
177
-
178
-
179
-
180
-
181
-
182
-
183
-
184
-
185
-
186
-
187
-
188
-
189
-
190
-
191
-
192
-
193
-
194
-
195
-
196
-
197
-
198
-
199
-
200
-
201
-
202
-
203
-
204
-
205
-
206
-
207
-
208
-
209
-
210
-
211
-
212
-
213
-
214
-
215
-
216
-
217
-
218
-
219
-
220
-
221
-
222
-
223
-
224
-
225
-
226
-
227
-
228
-
229
-
230
-
231
-
232
-
233
-
234
-
235
-
236
-
237
-
238
-
239
-
240
-
241
-
242
-
243
-
244
-
245
-
246
-
247
-
248
-
249
-
250
-
251
-
252
-
253
-
254
-
255
-
256
-
257
-
258
-
259
-
260
-
261
-
262
-
263
-
264
-
265
-
266
-
267
-
268
-
269
-
270
-
271
-
272
-
273
-
274
-
275
-
276
-
277
-
278
-
279
-
280
-
281
-
282
-
283
-
284
-
285
-
286
-
287
-
288
-
289
-
290
-
291
-
292
-
293
-
294
-
295
-
296
-
297
-
298
-
299
-
300
-
301
-
302
-
303
-
304
-
305
-
306
-
307
-
308
-
309
-
310
-
311
-
312
-
313
-
314
-
315
-
316
-
317
-
318
-
319
-
320
-
321
-
322
-
323
-
324
-
325
-
326
-
327
-
328
-
329
-
330
-
331
-
332
-
333
-
334
-
335
-
336
-
337
-
338
-
339
-
340
-
341
-
342
-
343
-
344
-
345
-
346
-
347
-
348
-
349
-
350
-
351
-
352
-
353
-
354
-
355
-
356
-
357
-
358
-
359
-
360
-
361
-
362
-
363
-
364
-
365
-
366
-
367
-
368
-
369
-
370
-
371
-
372
-
373
-
374
-
375
-
376
-
377
-
378
-
379
-
380
-
381
-
382
-
383
-
384
-
385
-
386
 |
 |

Table of Contents
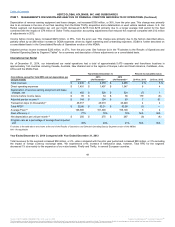
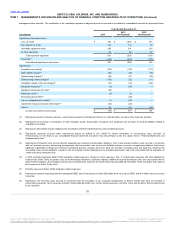
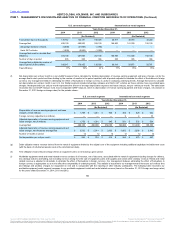
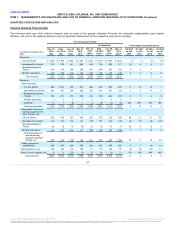
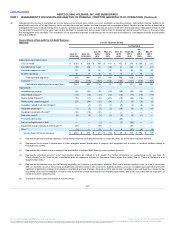
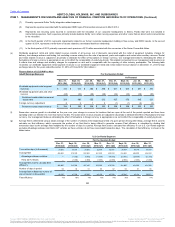
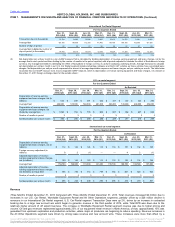
The following table sets forth selected financial data for each of the periods indicated. Amounts are computed independently each quarter,
therefore, the sum of the quarterly amounts may not equal the total amount for the respective year due to rounding.
Revenues:
U.S. Car Rental $ 1,482
$ 1,768
$ 1,663
$ 1,557
$ 1,475
$ 1,770
$ 1,602
$ 1,484
— %
— %
4 %
5 %
International Car Rental 518
795
641
482
544
768
595
471
(5)
4
8
2
Worldwide Equipment
Rental 416
413
384
358
401
403
381
353
4
2
1
1
All Other Operations 143
145
142
139
135
134
130
129
6
8
9
8
Total revenues 2,559
3,121
2,830
2,536
2,555
3,075
2,708
2,437
—
1
5
4
Expenses:
Direct operating:
U.S. Car Rental 982
1,041
990
907
888
933
865
847
11
12
14
7
International Car Rental 342
427
394
329
337
411
347
313
1
4
14
5
Worldwide Equipment
Rental 232
221
210
200
214
206
204
203
8
7
3
(1)
All Other Operations 6
6
6
7
6
6
6
6
—
—
—
17
Corporate 13
7
(6)
—
4
(9)
(5)
(5)
225
NM
NM
NM
Total direct operating 1,575
1,702
1,594
1,443
1,449
1,547
1,417
1,364
9
10
12
6
Depreciation of revenue
earning equipment and
lease charges, net:
U.S. Car Rental 533
409
391
424
337
337
323
285
58
21
21
49
International Car Rental 112
143
124
113
119
151
132
125
(6)
(5)
(6)
(10)
Worldwide Equipment
Rental 94
78
79
78
76
76
73
74
24
3
8
5
All Other Operations 114
116
114
111
109
108
104
105
5
7
10
6
Total depreciation of
revenue earning
equipment and lease
charges, net 853
746
708
726
641
672
632
589
33
11
12
23
Selling, general and
administrative 245
303
264
276
234
282
287
250
5
7
(8)
10
Interest expense, net 164
164
164
156
171
179
182
175
(4)
(8)
(10)
(11)
Other (income) expense, net 6
3
(21)
(3)
21
83
(2)
—
(71)
(96)
NM
NM
Total expenses 2,843
2,918
2,709
2,598
2,516
2,763
2,516
2,378
13
6
8
9
57
Source: HERTZ GLOBAL HOLDINGS INC, 10-K, July 16, 2015 Powered by Morningstar® Document Research℠
The information contained herein may not be copied, adapted or distributed and is not warranted to be accurate, complete or timely. The user assumes all risks for any damages or losses arising from any use of this information,
except to the extent such damages or losses cannot be limited or excluded by applicable law. Past financial performance is no guarantee of future results.