Hertz 2014 Annual Report Download - page 57
Download and view the complete annual report
Please find page 57 of the 2014 Hertz annual report below. You can navigate through the pages in the report by either clicking on the pages listed below, or by using the keyword search tool below to find specific information within the annual report.-
 1
1 -
2
-
3
-
4
-
5
-
6
-
7
-
8
-
9
-
10
-
11
-
12
-
13
-
14
-
15
-
16
-
17
-
18
-
19
-
20
-
21
-
22
-
23
-
24
-
25
-
26
-
27
-
28
-
29
-
30
-
31
-
32
-
33
-
34
-
35
-
36
-
37
-
38
-
39
-
40
-
41
-
42
-
43
-
44
-
45
-
46
-
 47
47 -
 48
48 -
 49
49 -
 50
50 -
 51
51 -
 52
52 -
 53
53 -
 54
54 -
 55
55 -
 56
56 -
 57
57 -
 58
58 -
 59
59 -
 60
60 -
 61
61 -
 62
62 -
 63
63 -
 64
64 -
 65
65 -
 66
66 -
 67
67 -
68
-
69
-
70
-
71
-
72
-
73
-
74
-
75
-
76
-
77
-
78
-
79
-
80
-
81
-
82
-
83
-
84
-
85
-
86
-
87
-
88
-
89
-
90
-
91
-
92
-
93
-
94
-
95
-
96
-
97
-
98
-
99
-
100
-
101
-
102
-
103
-
104
-
105
-
106
-
107
-
108
-
109
-
110
-
111
-
112
-
113
-
114
-
115
-
116
-
117
-
118
-
119
-
120
-
121
-
122
-
123
-
124
-
125
-
126
-
127
-
128
-
129
-
130
-
131
-
132
-
133
-
134
-
135
-
136
-
137
-
138
-
139
-
140
-
141
-
142
-
143
-
144
-
145
-
146
-
147
-
148
-
149
-
150
-
151
-
152
-
153
-
154
-
155
-
156
-
157
-
158
-
159
-
160
-
161
-
162
-
163
-
164
-
165
-
166
-
167
-
168
-
169
-
170
-
171
-
172
-
173
-
174
-
175
-
176
-
177
-
178
-
179
-
180
-
181
-
182
-
183
-
184
-
185
-
186
-
187
-
188
-
189
-
190
-
191
-
192
-
193
-
194
-
195
-
196
-
197
-
198
-
199
-
200
-
201
-
202
-
203
-
204
-
205
-
206
-
207
-
208
-
209
-
210
-
211
-
212
-
213
-
214
-
215
-
216
-
217
-
218
-
219
-
220
-
221
-
222
-
223
-
224
-
225
-
226
-
227
-
228
-
229
-
230
-
231
-
232
-
233
-
234
-
235
-
236
-
237
-
238
-
239
-
240
-
241
-
242
-
243
-
244
-
245
-
246
-
247
-
248
-
249
-
250
-
251
-
252
-
253
-
254
-
255
-
256
-
257
-
258
-
259
-
260
-
261
-
262
-
263
-
264
-
265
-
266
-
267
-
268
-
269
-
270
-
271
-
272
-
273
-
274
-
275
-
276
-
277
-
278
-
279
-
280
-
281
-
282
-
283
-
284
-
285
-
286
-
287
-
288
-
289
-
290
-
291
-
292
-
293
-
294
-
295
-
296
-
297
-
298
-
299
-
300
-
301
-
302
-
303
-
304
-
305
-
306
-
307
-
308
-
309
-
310
-
311
-
312
-
313
-
314
-
315
-
316
-
317
-
318
-
319
-
320
-
321
-
322
-
323
-
324
-
325
-
326
-
327
-
328
-
329
-
330
-
331
-
332
-
333
-
334
-
335
-
336
-
337
-
338
-
339
-
340
-
341
-
342
-
343
-
344
-
345
-
346
-
347
-
348
-
349
-
350
-
351
-
352
-
353
-
354
-
355
-
356
-
357
-
358
-
359
-
360
-
361
-
362
-
363
-
364
-
365
-
366
-
367
-
368
-
369
-
370
-
371
-
372
-
373
-
374
-
375
-
376
-
377
-
378
-
379
-
380
-
381
-
382
-
383
-
384
-
385
-
386
 |
 |

Table of Contents
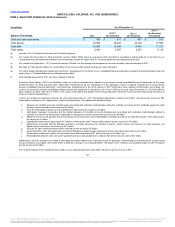
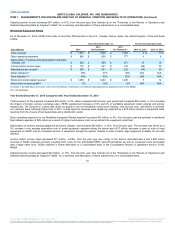
a decrease in the valuation allowance relating to losses in certain non-U.S. jurisdictions for which tax benefits are not realized.
Adjusted pre-tax income increased $280 million, or 34%, from the prior year. See footnote (b) in the "Footnotes to the Results of Operations and
Selected Operating Data by Segment Tables" for a summary and description of these adjustments on a consolidated basis.
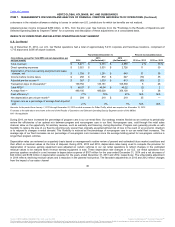
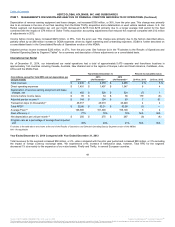
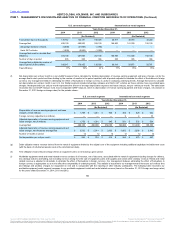
As of December 31, 2014, our U.S. Car Rental operations had a total of approximately 5,410 corporate and franchisee locations, comprised of
1,715 airport and 3,695 off airport locations.
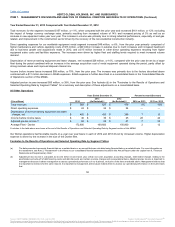
Total revenues $ 6,471
$ 6,331
$ 4,888
2 %
30 %
Direct operating expenses $ 3,921
$ 3,531
$ 2,726
11
30
Depreciation of revenue earning equipment and lease
charges, net $ 1,758
$ 1,281
$ 945
37
36
Income before income taxes $ 258
$ 872
$ 647
(70)
35
Adjusted pre-tax income (b) $ 387
$ 1,033
$ 813
(63)
27
Transaction days (in thousands)(c) 139,752
133,181
105,539
5
26
Total RPD(d) $ 46.07
$ 46.94
$ 46.22
(2)
2
Average fleet (e) 499,100
490,000
359,100
2
36
Fleet efficiency(e) 77%
78%
81%
N/A
N/A
Net depreciation per unit per month (f) $ 294
$ 218
$ 219
35
—
Program cars as a percentage of average fleet at period
end 21%
9%
5%
N/A
N/A
During 2014, we have increased the percentage of program cars in our car rental fleet. Our strategy remains flexible as we continue to periodically
review the efficiencies of an optimal mix between program and non-program cars in our fleet. Non-program cars, sold through the retail sales
channel, allow us the opportunity for ancillary revenue, such as warranty and financing, during disposition. Program cars generally provide us with
flexibility to reduce the size of our fleet by returning cars sooner than originally expected without risk of loss in the event of an economic downturn
or to respond to changes in rental demand. This flexibility is reduced as the percentage of non-program cars in our car rental fleet increases. The
average age of our fleet increases as our percentage of non-program cars increases since the average holding period for non-program vehicles is
longer than program vehicles.
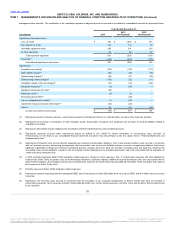
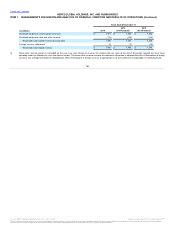
Depreciation rates are reviewed on a quarterly basis based on management's routine review of present and estimated future market conditions and
their effect on residual values at the time of disposal. During 2014, 2013 and 2012, depreciation rates being used to compute the provision for
depreciation of revenue earning equipment were adjusted on certain vehicles in our car rental operations to reflect changes in the estimated
residual values to be realized when revenue earning equipment is sold. These depreciation rate changes in our U.S. car rental operations from
previous quarters resulted in a net increase in depreciation expense of $167 million for the year ended December 31, 2014 and a net decrease of
$44 million and $139 million in depreciation expense for the years ended December 31, 2013 and 2012, respectively. The unfavorable adjustment
in 2014 reflects declining residual values and a reduction in the planned hold period. The favorable adjustments in 2013 and 2012 reflect changes
from the impact of car sales channel
46
Source: HERTZ GLOBAL HOLDINGS INC, 10-K, July 16, 2015 Powered by Morningstar® Document Research℠
The information contained herein may not be copied, adapted or distributed and is not warranted to be accurate, complete or timely. The user assumes all risks for any damages or losses arising from any use of this information,
except to the extent such damages or losses cannot be limited or excluded by applicable law. Past financial performance is no guarantee of future results.