Hertz 2014 Annual Report Download - page 55
Download and view the complete annual report
Please find page 55 of the 2014 Hertz annual report below. You can navigate through the pages in the report by either clicking on the pages listed below, or by using the keyword search tool below to find specific information within the annual report.-
 1
1 -
2
-
3
-
4
-
5
-
6
-
7
-
8
-
9
-
10
-
11
-
12
-
13
-
14
-
15
-
16
-
17
-
18
-
19
-
20
-
21
-
22
-
23
-
24
-
25
-
26
-
27
-
28
-
29
-
30
-
31
-
32
-
33
-
34
-
35
-
36
-
37
-
38
-
39
-
40
-
41
-
42
-
43
-
44
-
 45
45 -
 46
46 -
 47
47 -
 48
48 -
 49
49 -
 50
50 -
 51
51 -
 52
52 -
 53
53 -
 54
54 -
 55
55 -
 56
56 -
 57
57 -
 58
58 -
 59
59 -
 60
60 -
 61
61 -
 62
62 -
 63
63 -
 64
64 -
 65
65 -
66
-
67
-
68
-
69
-
70
-
71
-
72
-
73
-
74
-
75
-
76
-
77
-
78
-
79
-
80
-
81
-
82
-
83
-
84
-
85
-
86
-
87
-
88
-
89
-
90
-
91
-
92
-
93
-
94
-
95
-
96
-
97
-
98
-
99
-
100
-
101
-
102
-
103
-
104
-
105
-
106
-
107
-
108
-
109
-
110
-
111
-
112
-
113
-
114
-
115
-
116
-
117
-
118
-
119
-
120
-
121
-
122
-
123
-
124
-
125
-
126
-
127
-
128
-
129
-
130
-
131
-
132
-
133
-
134
-
135
-
136
-
137
-
138
-
139
-
140
-
141
-
142
-
143
-
144
-
145
-
146
-
147
-
148
-
149
-
150
-
151
-
152
-
153
-
154
-
155
-
156
-
157
-
158
-
159
-
160
-
161
-
162
-
163
-
164
-
165
-
166
-
167
-
168
-
169
-
170
-
171
-
172
-
173
-
174
-
175
-
176
-
177
-
178
-
179
-
180
-
181
-
182
-
183
-
184
-
185
-
186
-
187
-
188
-
189
-
190
-
191
-
192
-
193
-
194
-
195
-
196
-
197
-
198
-
199
-
200
-
201
-
202
-
203
-
204
-
205
-
206
-
207
-
208
-
209
-
210
-
211
-
212
-
213
-
214
-
215
-
216
-
217
-
218
-
219
-
220
-
221
-
222
-
223
-
224
-
225
-
226
-
227
-
228
-
229
-
230
-
231
-
232
-
233
-
234
-
235
-
236
-
237
-
238
-
239
-
240
-
241
-
242
-
243
-
244
-
245
-
246
-
247
-
248
-
249
-
250
-
251
-
252
-
253
-
254
-
255
-
256
-
257
-
258
-
259
-
260
-
261
-
262
-
263
-
264
-
265
-
266
-
267
-
268
-
269
-
270
-
271
-
272
-
273
-
274
-
275
-
276
-
277
-
278
-
279
-
280
-
281
-
282
-
283
-
284
-
285
-
286
-
287
-
288
-
289
-
290
-
291
-
292
-
293
-
294
-
295
-
296
-
297
-
298
-
299
-
300
-
301
-
302
-
303
-
304
-
305
-
306
-
307
-
308
-
309
-
310
-
311
-
312
-
313
-
314
-
315
-
316
-
317
-
318
-
319
-
320
-
321
-
322
-
323
-
324
-
325
-
326
-
327
-
328
-
329
-
330
-
331
-
332
-
333
-
334
-
335
-
336
-
337
-
338
-
339
-
340
-
341
-
342
-
343
-
344
-
345
-
346
-
347
-
348
-
349
-
350
-
351
-
352
-
353
-
354
-
355
-
356
-
357
-
358
-
359
-
360
-
361
-
362
-
363
-
364
-
365
-
366
-
367
-
368
-
369
-
370
-
371
-
372
-
373
-
374
-
375
-
376
-
377
-
378
-
379
-
380
-
381
-
382
-
383
-
384
-
385
-
386
 |
 |

Table of Contents
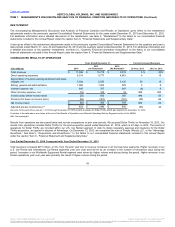
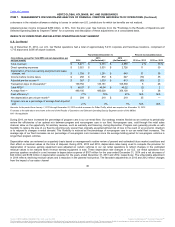
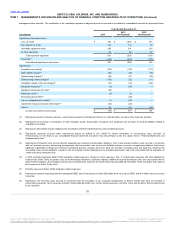
Direct operating expenses increased $537 million, or 9%, from the prior year primarily due to increases in our U.S. and International car rental
segments of $390 million and $84 million, respectively, and an increase of $37 million in our Worldwide Equipment Rental segment. The increases
were the result of higher fleet related costs and other direct operating expenses during the period.
Depreciation of revenue earning equipment and lease charges, net increased $501 million, or 20%, from the prior year primarily due to an increase
of $477 million in our U.S. Car Rental segment. The increase was largely driven by higher per-vehicle depreciation rates due to declining residual
values and a reduction in the planned holding period for the fleet as we implemented our new fleet strategy. Additionally, 2013 U.S. Car Rental
segment depreciation was favorably impacted by $79 million of Dollar Thrifty acquisition accounting adjustments and due to implementation of a
longer planned hold period for the fleet.
SG&A expenses during the year ended December 31, 2014 increased $35 million, or 3%, as compared with 2013. The change was primarily due to
$39 million of separation costs associated with the anticipated HERC spin-off transaction, approximately $30 million in costs associated with the
previously disclosed accounting review and investigation, $13 million related to the impairment of our former corporate headquarters and $9 million
in costs associated with the Dollar Thrifty integration. The above was partially offset by decreases in marketing, co-branding and promotional
activity in our U.S. Car Rental operations.
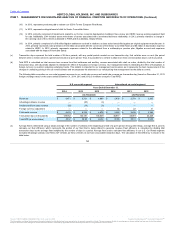
Interest expense, net decreased $59 million, or 8%, during the year ended December 31, 2014 as compared with 2013. The change was primarily
due to a lower average interest rate on fleet debt in our U.S. Car Rental segment resulting from an increase to the component of floating rate debt
relative to fixed rate debt, as well as a lower average interest rate on fleet debt in our International Car Rental segment resulting from the European
fleet financings completed during the period.
We had other income of $15 million in the year ended December 31, 2014 compared with other expense of $102 million in the prior year period.
Other income in the 2014 period is primarily comprised of a $19 million litigation settlement received in relation to a class action lawsuit filed
against an original equipment manufacturer stemming from recalls of their vehicles in previous years. Other income in 2014 also included our
share of earnings from our equity method and joint venture investments. Other income in 2014 was partially offset by a $14 million charge for
service equipment that was deemed to not have a future use. Other expense of $102 million in 2013 is primarily comprised of $40 million of
impairment charges and asset write-downs, $35 million of debt extinguishment loss and inducement costs related to the early conversion of a
portion of our Convertible Senior Notes and $29 million of premiums paid and write-offs relating to our European debt. The impairment charges and
asset write-downs were related to vehicles subleased to FSNA, the parent of Simply Wheelz, LLC, the owner and operator of our divested
Advantage brand, as further described in Note 5, "Acquisitions and Divestitures," to the Notes to our consolidated financial statements included in
this Annual Report under the caption Item 8, "Financial Statements and Supplementary Data."
We had a loss before income taxes of $23 million in 2014 compared with income before income taxes of $603 million in 2013. This decrease in
income before income taxes was primarily due to increased operating costs in the U.S. car rental segment due to damage, maintenance
expenditures associated with higher mileage cars in the fleet and increased personnel costs to support the higher mileage fleet, and higher
depreciation rates due to declining residual values and a reduction in the planned hold period as we implemented our new fleet strategy.
Additionally, 2013 included $79 million of Dollar Thrifty acquisition adjustments that reduced depreciation expense. In addition, we experienced
higher maintenance costs in the worldwide equipment rental segment in 2014 due to the investment made to improve the fleet available to rent and
sales costs due to an increase in sales force personnel to focus on winning new accounts and diversifying the customer base. These decreases
were partially offset by a decrease in other expenses year over year, as discussed above.
The effective tax rate for the year ended December 31, 2014 was (257)% as compared to 50% for the year ended December 31, 2013. The
provision for taxes on income decreased $242 million, primarily due to lower income before income taxes, changes in geographic earnings mix,
non-deductible transaction costs, decreased state and local tax rates and a decrease in the valuation allowance relating to losses in certain non-
US jurisdictions for which tax benefits are not realized, offset by an increase in unrecognized tax benefits accrued during the year.
44
Source: HERTZ GLOBAL HOLDINGS INC, 10-K, July 16, 2015 Powered by Morningstar® Document Research℠
The information contained herein may not be copied, adapted or distributed and is not warranted to be accurate, complete or timely. The user assumes all risks for any damages or losses arising from any use of this information,
except to the extent such damages or losses cannot be limited or excluded by applicable law. Past financial performance is no guarantee of future results.