Dollar General 2007 Annual Report Download - page 98
Download and view the complete annual report
Please find page 98 of the 2007 Dollar General annual report below. You can navigate through the pages in the report by either clicking on the pages listed below, or by using the keyword search tool below to find specific information within the annual report.-
 1
1 -
2
-
3
-
4
-
5
-
6
-
7
-
8
-
9
-
10
-
11
-
12
-
13
-
14
-
15
-
16
-
17
-
18
-
19
-
20
-
21
-
22
-
23
-
24
-
25
-
26
-
27
-
28
-
29
-
30
-
31
-
32
-
33
-
34
-
35
-
36
-
37
-
38
-
39
-
40
-
41
-
42
-
43
-
44
-
45
-
46
-
47
-
48
-
49
-
50
-
51
-
52
-
53
-
54
-
55
-
56
-
57
-
58
-
59
-
60
-
61
-
62
-
63
-
64
-
65
-
66
-
67
-
68
-
69
-
70
-
71
-
72
-
73
-
74
-
75
-
76
-
77
-
78
-
79
-
80
-
81
-
82
-
83
-
84
-
85
-
86
-
87
-
 88
88 -
 89
89 -
 90
90 -
 91
91 -
 92
92 -
 93
93 -
 94
94 -
 95
95 -
 96
96 -
 97
97 -
 98
98 -
 99
99 -
 100
100 -
 101
101 -
 102
102 -
 103
103 -
 104
104 -
 105
105 -
 106
106 -
 107
107 -
 108
108 -
109
-
110
-
111
-
112
-
113
-
114
-
115
-
116
-
117
-
118
-
119
-
120
-
121
-
122
-
123
-
124
-
125
-
126
-
127
-
128
-
129
-
130
-
131
-
132
-
133
-
134
-
135
-
136
-
137
-
138
-
139
-
140
-
141
-
142
-
143
-
144
-
145
-
146
-
147
-
148
-
149
-
150
-
151
-
152
-
153
-
154
-
155
-
156
-
157
-
158
-
159
-
160
-
161
-
162
-
163
-
164
-
165
-
166
-
167
-
168
-
169
-
170
-
171
-
172
-
173
-
174
-
175
-
176
-
177
-
178
-
179
-
180
-
181
-
182
-
183
 |
 |

96
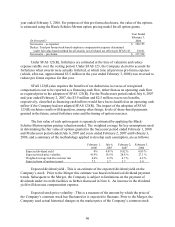
year ended February 3, 2006. For purposes of this pro forma disclosure, the value of the options
is estimated using the Black-Scholes-Merton option pricing model for all option grants.
(In thousands)
Year Ended
February 3,
2006
Net income – as reported $ 350,155
Deduct: Total pro forma stock-based employee compensation expense determined
under fair value based method for all awards, net of related tax effects per SFAS 123 32,621
Net income – pro forma $ 317,534
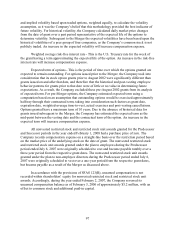
Under SFAS 123(R), forfeitures are estimated at the time of valuation and reduce
expense ratably over the vesting period. Under SFAS 123, the Company elected to account for
forfeitures when awards were actually forfeited, at which time all previous pro forma expense
(which, after-tax, approximated $5.5 million in the year ended February 3, 2006) was reversed to
reduce pro forma expense for that year.
SFAS 123(R) also requires the benefits of tax deductions in excess of recognized
compensation cost to be reported as a financing cash flow, rather than as an operating cash flow
as required prior to the adoption of SFAS 123(R). For the Predecessor period ended July 6, 2007
and year ended February 2, 2007, the $3.9 million and $2.5 million excess tax benefits,
respectively, classified as financing cash inflows would have been classified as an operating cash
inflow if the Company had not adopted SFAS 123(R). The impact of the adoption of SFAS
123(R) on future results will depend on, among other things, levels of share-based payments
granted in the future, actual forfeiture rates and the timing of option exercises.
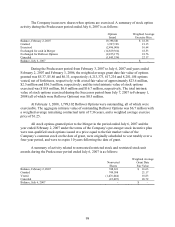
The fair value of each option grant is separately estimated by applying the Black-
Scholes-Merton option pricing valuation model. The weighted average for key assumptions used
in determining the fair value of options granted in the Successor period ended February 1, 2008
and Predecessor period ended July 6, 2007 and years ended February 2, 2007 and February 3,
2006, and a summary of the methodology applied to develop each assumption, are as follows:
February 1,
2008
July 6,
2007
February 2,
2007
February 3,
2006
Expected dividend yield 0% 0.91% 0.82 % 0.85 %
Expected stock price volatility 41.9% 18.5% 28.8 % 27.1 %
Weighted average risk-free interest rate 4.6% 4.5% 4.7 % 4.2 %
Expected term of options (years) 7.5 5.7 5.7 5.0
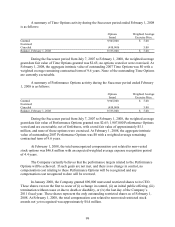
Expected dividend yield - This is an estimate of the expected dividend yield on the
Company’ s stock. Prior to the Merger this estimate was based on historical dividend payment
trends. Subsequent to the Merger, the Company is subject to limitations on the payment of
dividends under its credit facilities as further discussed in Note 6. An increase in the dividend
yield will decrease compensation expense.
Expected stock price volatility - This is a measure of the amount by which the price of
the Company’ s common stock has fluctuated or is expected to fluctuate. Prior to the Merger, the
Company used actual historical changes in the market price of the Company’ s common stock