Dollar General 2007 Annual Report Download - page 34
Download and view the complete annual report
Please find page 34 of the 2007 Dollar General annual report below. You can navigate through the pages in the report by either clicking on the pages listed below, or by using the keyword search tool below to find specific information within the annual report.-
 1
1 -
2
-
3
-
4
-
5
-
6
-
7
-
8
-
9
-
10
-
11
-
12
-
13
-
14
-
15
-
16
-
17
-
18
-
19
-
20
-
21
-
22
-
23
-
 24
24 -
 25
25 -
 26
26 -
 27
27 -
 28
28 -
 29
29 -
 30
30 -
 31
31 -
 32
32 -
 33
33 -
 34
34 -
 35
35 -
 36
36 -
 37
37 -
 38
38 -
 39
39 -
 40
40 -
 41
41 -
 42
42 -
 43
43 -
 44
44 -
45
-
46
-
47
-
48
-
49
-
50
-
51
-
52
-
53
-
54
-
55
-
56
-
57
-
58
-
59
-
60
-
61
-
62
-
63
-
64
-
65
-
66
-
67
-
68
-
69
-
70
-
71
-
72
-
73
-
74
-
75
-
76
-
77
-
78
-
79
-
80
-
81
-
82
-
83
-
84
-
85
-
86
-
87
-
88
-
89
-
90
-
91
-
92
-
93
-
94
-
95
-
96
-
97
-
98
-
99
-
100
-
101
-
102
-
103
-
104
-
105
-
106
-
107
-
108
-
109
-
110
-
111
-
112
-
113
-
114
-
115
-
116
-
117
-
118
-
119
-
120
-
121
-
122
-
123
-
124
-
125
-
126
-
127
-
128
-
129
-
130
-
131
-
132
-
133
-
134
-
135
-
136
-
137
-
138
-
139
-
140
-
141
-
142
-
143
-
144
-
145
-
146
-
147
-
148
-
149
-
150
-
151
-
152
-
153
-
154
-
155
-
156
-
157
-
158
-
159
-
160
-
161
-
162
-
163
-
164
-
165
-
166
-
167
-
168
-
169
-
170
-
171
-
172
-
173
-
174
-
175
-
176
-
177
-
178
-
179
-
180
-
181
-
182
-
183
 |
 |
32
increases were partially offset by insurance proceeds of $13.0 million received during the period
related to losses incurred due to Hurricane Katrina, and depreciation and amortization expenses
that remained relatively constant in fiscal 2006 as compared to fiscal 2005.
Transaction and Related Costs. The $102.6 million of expenses recorded in 2007 reflect
$63.2 million of expenses related to the Merger, such as investment banking and legal fees as
well as $39.4 million of compensation expense related to stock options, restricted stock and
restricted stock units which were fully vested immediately prior to the Merger.
Interest Income. Interest income in 2007 consists primarily of interest on short-term
investments. The increase in 2007 from 2006 resulted from higher levels of cash and short term
investments on hand, primarily in the first half of the year. The decrease in 2006 compared to
2005 was due primarily to the acquisition of the entity which held legal title to the South Boston
distribution center in June 2006 and the related elimination of the note receivable which
represented debt issued by this entity from which we formerly leased the South Boston
distribution center.
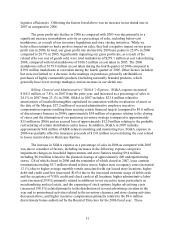
Interest Expense. Interest expense increased by $228.3 million in 2007 as compared to
2006 due to interest on long-term obligations incurred to finance the Merger. See further
discussion under “Liquidity and Capital Resources” below. We had outstanding variable-rate
debt of $787.0 million, after taking into consideration the impact of interest rate swaps, as of
February 1, 2008. The remainder of our outstanding indebtedness at February 1, 2008 was fixed
rate debt.
The increase in interest expense in 2006 was primarily attributable to increased interest
expense of $6.5 million under a revolving credit agreement primarily due to increased
borrowings, an increase in tax-related interest of $4.1 million, offset by a reduction in interest
expense associated with the elimination of a financing obligation on the South Boston
distribution center.
Loss on Interest Rate Swaps. During 2007, we recorded an unrealized loss of $4.1 million
related to the change in the fair value of interest swaps prior to the designation of such swaps as
cash flow hedges in October 2007. This loss is offset by earnings of $1.7 million under the
contractual provisions of the swap agreements.
Loss on Debt Retirements, Net. During 2007, we recorded $6.2 million of expenses
related to consent fees and other costs associated with a tender offer for certain notes payable
maturing in June 2010 (“2010 Notes”). Approximately 99% of the 2010 Notes were retired as a
result of the tender offer. The costs related to the tender of the 2010 Notes were partially offset
by a $4.9 million gain resulting from the repurchase of $25.0 million of our 11.875%/12.625%
Senior Subordinated Notes, due July 15, 2017.
Income Taxes. The effective income tax rates for the Successor period ended February 1,
2008, and the Predecessor periods ended July 6, 2007, 2006 and 2005 were a benefit of 26.9%
and expense of 300.2%, 37.4% and 35.7%, respectively.