Dollar General 2007 Annual Report Download - page 57
Download and view the complete annual report
Please find page 57 of the 2007 Dollar General annual report below. You can navigate through the pages in the report by either clicking on the pages listed below, or by using the keyword search tool below to find specific information within the annual report.-
 1
1 -
2
-
3
-
4
-
5
-
6
-
7
-
8
-
9
-
10
-
11
-
12
-
13
-
14
-
15
-
16
-
17
-
18
-
19
-
20
-
21
-
22
-
23
-
24
-
25
-
26
-
27
-
28
-
29
-
30
-
31
-
32
-
33
-
34
-
35
-
36
-
37
-
38
-
39
-
40
-
41
-
42
-
43
-
44
-
45
-
46
-
 47
47 -
 48
48 -
 49
49 -
 50
50 -
 51
51 -
 52
52 -
 53
53 -
 54
54 -
 55
55 -
 56
56 -
 57
57 -
 58
58 -
 59
59 -
 60
60 -
 61
61 -
 62
62 -
 63
63 -
 64
64 -
 65
65 -
 66
66 -
 67
67 -
68
-
69
-
70
-
71
-
72
-
73
-
74
-
75
-
76
-
77
-
78
-
79
-
80
-
81
-
82
-
83
-
84
-
85
-
86
-
87
-
88
-
89
-
90
-
91
-
92
-
93
-
94
-
95
-
96
-
97
-
98
-
99
-
100
-
101
-
102
-
103
-
104
-
105
-
106
-
107
-
108
-
109
-
110
-
111
-
112
-
113
-
114
-
115
-
116
-
117
-
118
-
119
-
120
-
121
-
122
-
123
-
124
-
125
-
126
-
127
-
128
-
129
-
130
-
131
-
132
-
133
-
134
-
135
-
136
-
137
-
138
-
139
-
140
-
141
-
142
-
143
-
144
-
145
-
146
-
147
-
148
-
149
-
150
-
151
-
152
-
153
-
154
-
155
-
156
-
157
-
158
-
159
-
160
-
161
-
162
-
163
-
164
-
165
-
166
-
167
-
168
-
169
-
170
-
171
-
172
-
173
-
174
-
175
-
176
-
177
-
178
-
179
-
180
-
181
-
182
-
183
 |
 |

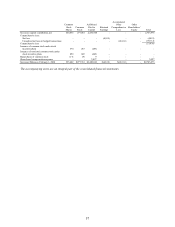
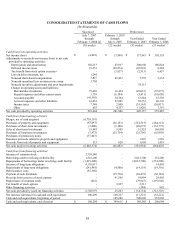
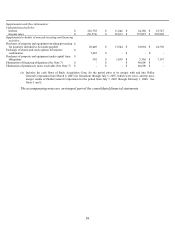
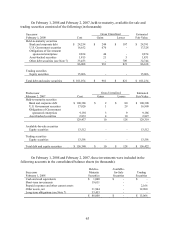
55
CONSOLIDATED STATEMENTS OF OPERATIONS
(In thousands)
Successor Predecessor
For the years ended
July 7, 2007
through
February 1, 2008 (a)
February 3, 2007
through
July 6, 2007
February 2,
2007
February 3,
2006
(30 weeks) (22 weeks) (52 weeks) (53 weeks)
Net sales $ 5,571,493 $ 3,923,753 $ 9,169,822 $ 8,582,237
Cost of goods sold 3,999,599 2,852,178 6,801,617 6,117,413
Gross profit 1,571,894 1,071,575 2,368,205 2,464,824
Selling, general and administrative 1,324,508 960,930 2,119,929 1,902,957
Transaction and related costs 1,242 101,397 - -
Operating profit 246,144 9,248 248,276 561,867
Interest income (3,799) (5,046) (7,002) (9,001)
Interest expense 252,897 10,299 34,915 26,226
Loss on interest rate swaps 2,390 - - -
Loss on debt retirement, net 1,249 - - -
Income (loss) before income taxes (6,593) 3,995 220,363 544,642
Income tax expense (benefit) (1,775) 11,993 82,420 194,487
Net income (loss) $ (4,818) $ (7,998) $ 137,943 $ 350,155
(a) Includes the results of operations of Buck Acquisition Corp. for the period prior to its merger with and into
Dollar General Corporation from March 6, 2007 (its formation) through July 6, 2007 (reflecting the change in
fair value of interest rate swaps), and the post-merger results of Dollar General Corporation for the period from
July 7, 2007 through February 1, 2008. See Notes 1 and 2.
The accompanying notes are an integral part of the consolidated financial statements.