Dollar General 2007 Annual Report Download - page 80
Download and view the complete annual report
Please find page 80 of the 2007 Dollar General annual report below. You can navigate through the pages in the report by either clicking on the pages listed below, or by using the keyword search tool below to find specific information within the annual report.-
 1
1 -
2
-
3
-
4
-
5
-
6
-
7
-
8
-
9
-
10
-
11
-
12
-
13
-
14
-
15
-
16
-
17
-
18
-
19
-
20
-
21
-
22
-
23
-
24
-
25
-
26
-
27
-
28
-
29
-
30
-
31
-
32
-
33
-
34
-
35
-
36
-
37
-
38
-
39
-
40
-
41
-
42
-
43
-
44
-
45
-
46
-
47
-
48
-
49
-
50
-
51
-
52
-
53
-
54
-
55
-
56
-
57
-
58
-
59
-
60
-
61
-
62
-
63
-
64
-
65
-
66
-
67
-
68
-
69
-
 70
70 -
 71
71 -
 72
72 -
 73
73 -
 74
74 -
 75
75 -
 76
76 -
 77
77 -
 78
78 -
 79
79 -
 80
80 -
 81
81 -
 82
82 -
 83
83 -
 84
84 -
 85
85 -
 86
86 -
 87
87 -
 88
88 -
 89
89 -
 90
90 -
91
-
92
-
93
-
94
-
95
-
96
-
97
-
98
-
99
-
100
-
101
-
102
-
103
-
104
-
105
-
106
-
107
-
108
-
109
-
110
-
111
-
112
-
113
-
114
-
115
-
116
-
117
-
118
-
119
-
120
-
121
-
122
-
123
-
124
-
125
-
126
-
127
-
128
-
129
-
130
-
131
-
132
-
133
-
134
-
135
-
136
-
137
-
138
-
139
-
140
-
141
-
142
-
143
-
144
-
145
-
146
-
147
-
148
-
149
-
150
-
151
-
152
-
153
-
154
-
155
-
156
-
157
-
158
-
159
-
160
-
161
-
162
-
163
-
164
-
165
-
166
-
167
-
168
-
169
-
170
-
171
-
172
-
173
-
174
-
175
-
176
-
177
-
178
-
179
-
180
-
181
-
182
-
183
 |
 |
78
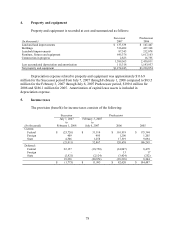
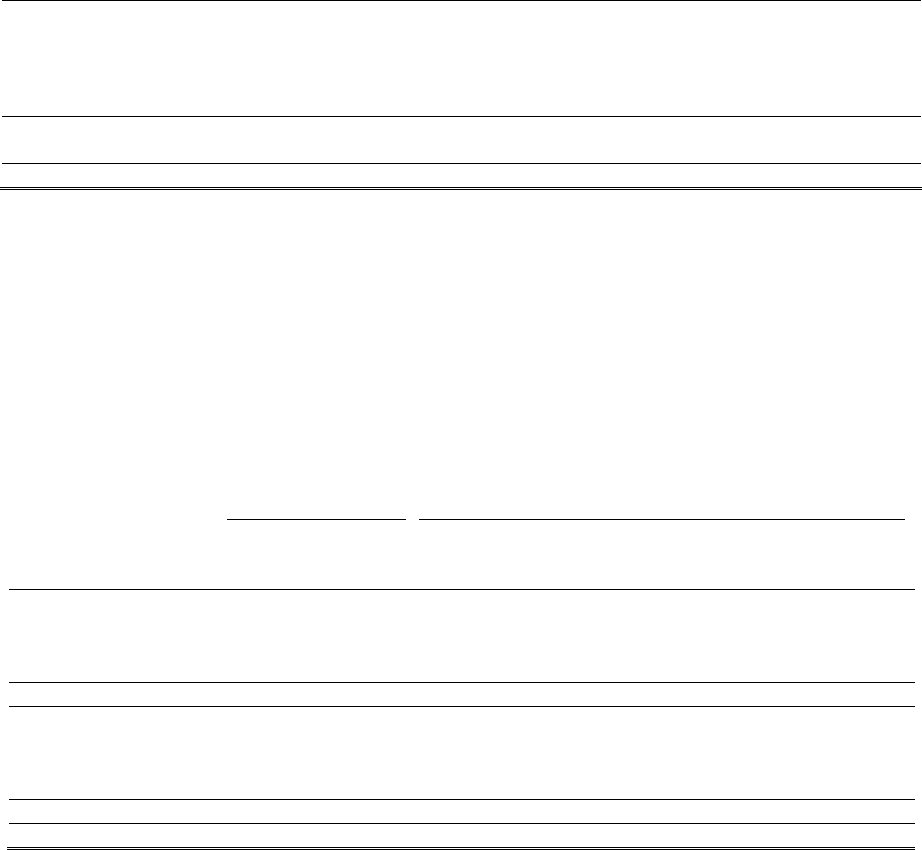
4. Property and equipment
Property and equipment is recorded at cost and summarized as follows:
(In thousands) Successor
2007
Predecessor
2006
Land and land improvements $ 137,539 $ 147,447
Buildings 516,482 437,368
Leasehold improvements 87,343 212,078
Furniture, fixtures and equipment 645,376 1,617,163
Construction in progress 2,823 16,755
1,389,563 2,430,811
Less accumulated depreciation and amortization 115,318 1,193,937
Net property and equipment $1,274,245 $1,236,874
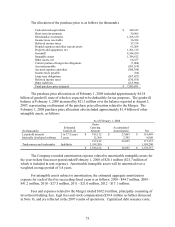
Depreciation expense related to property and equipment was approximately $116.9
million for the Successor period from July 7, 2007 through February 1, 2008 compared to $83.5
million for the February 3, 2007 through July 6, 2007 Predecessor period, $199.6 million for
2006 and $186.1 million for 2005. Amortization of capital lease assets is included in
depreciation expense.
5. Income taxes
The provision (benefit) for income taxes consists of the following:
Successor Predecessor
(In thousands)
July 7, 2007
to
February 1, 2008
February 3, 2007
to
July 6, 2007 2006 2005
Current:
Federal $ (25,726) $ 31,114 $ 101,919 $ 175,344
Foreign 409 495 1,200 1,205
State 4,306 1,258 17,519 9,694
(21,011) 32,867 120,638 186,243
Deferred:
Federal 22,157 (18,750) (34,807) 8,479
Foreign - - 13 17
State (2,921) (2,124) (3,424) (252)
19,236 (20,874) (38,218) 8,244
$ (1,775) $ 11,993 $ 82,420 $ 194,487