Dollar General 2007 Annual Report Download - page 104
Download and view the complete annual report
Please find page 104 of the 2007 Dollar General annual report below. You can navigate through the pages in the report by either clicking on the pages listed below, or by using the keyword search tool below to find specific information within the annual report.-
 1
1 -
2
-
3
-
4
-
5
-
6
-
7
-
8
-
9
-
10
-
11
-
12
-
13
-
14
-
15
-
16
-
17
-
18
-
19
-
20
-
21
-
22
-
23
-
24
-
25
-
26
-
27
-
28
-
29
-
30
-
31
-
32
-
33
-
34
-
35
-
36
-
37
-
38
-
39
-
40
-
41
-
42
-
43
-
44
-
45
-
46
-
47
-
48
-
49
-
50
-
51
-
52
-
53
-
54
-
55
-
56
-
57
-
58
-
59
-
60
-
61
-
62
-
63
-
64
-
65
-
66
-
67
-
68
-
69
-
70
-
71
-
72
-
73
-
74
-
75
-
76
-
77
-
78
-
79
-
80
-
81
-
82
-
83
-
84
-
85
-
86
-
87
-
88
-
89
-
90
-
91
-
92
-
93
-
 94
94 -
 95
95 -
 96
96 -
 97
97 -
 98
98 -
 99
99 -
 100
100 -
 101
101 -
 102
102 -
 103
103 -
 104
104 -
 105
105 -
 106
106 -
 107
107 -
 108
108 -
 109
109 -
 110
110 -
 111
111 -
 112
112 -
 113
113 -
 114
114 -
115
-
116
-
117
-
118
-
119
-
120
-
121
-
122
-
123
-
124
-
125
-
126
-
127
-
128
-
129
-
130
-
131
-
132
-
133
-
134
-
135
-
136
-
137
-
138
-
139
-
140
-
141
-
142
-
143
-
144
-
145
-
146
-
147
-
148
-
149
-
150
-
151
-
152
-
153
-
154
-
155
-
156
-
157
-
158
-
159
-
160
-
161
-
162
-
163
-
164
-
165
-
166
-
167
-
168
-
169
-
170
-
171
-
172
-
173
-
174
-
175
-
176
-
177
-
178
-
179
-
180
-
181
-
182
-
183
 |
 |

102
Successor Predecessor
(In thousands)
July 7, 2007
through
February 1, 2008
February 1, 2007
through
July 6, 2007 2006 2005
Classes of similar products:
Highly consumable $ 3,701,724 $ 2,615,110 $ 6,022,014 $ 5,606,466
Seasonal 908,301 604,935 1,509,999 1,348,769
Home products 507,027 362,725 914,357 907,826
Basic clothing 454,441 340,983 723,452 719,176
Net sales $ 5,571,493 $ 3,923,753 $ 9,169,822 $ 8,582,237
14. Subsequent event
Subsequent to the 2007 fiscal year end, the Company entered into a $350.0 million step-
down interest rate swap which became effective February 28, 2008 in order to mitigate an
additional portion of the variable rate interest exposure under the New Credit Facilities discussed
in Note 6. The Company entered into the swap with Wachovia Capital Markets and the terms
result in the Company paying a fixed rate of 5.58% on a notional amount of $350.0 million for
the first year and $150.0 million for the second year.
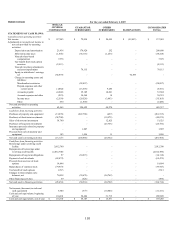
15. Quarterly financial data (unaudited)
The following is selected unaudited quarterly financial data for the fiscal years ended
February 1, 2008 and February 2, 2007. Each quarter listed below was a 13-week accounting
period. The sum of the four quarters for any given year may not equal annual totals due to
rounding.
(In thousands) Predecessor Successor
First
Quarter
May 5, 2007 -
July 6, 2007
July 7, 2007 -
August 3,
2007 (a)
Third
Quarter
Fourth
Quarter
2007:
Net sales $ 2,275,267 $ 1,648,486 $ 699,078 $ 2,312,842 $ 2,559,573
Gross profit 633,060 438,515 184,723 646,800 740,371
Operating
profit (loss)
55,368
(46,120) (6,025) 65,703 186,466
Net income
(loss)
34,875
(42,873) (27,175) (33,032) 55,389
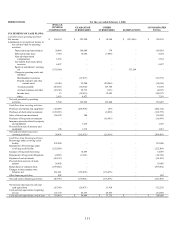
Predecessor
First
Quarter
Second
Quarter
Third
Quarter
Fourth
Quarter
2006:
Net sales $ 2,151,387 $ 2,251,053 $ 2,213,396 $ 2,553,986
Gross profit 584,274 611,534 526,447 645,950
Operating profit 81,285 80,577 3,339 83,075
Net income (loss) 47,670 45,468 (5,285) 50,090
(a) Includes the results of operations of Buck Acquisition Corp. for the period prior to its merger with and into
Dollar General Corporation from March 6, 2007 (its formation) through July 6, 2007 (reflecting the change in
fair value of interest rate swaps), and the post-merger results of Dollar General Corporation for the period from
July 7, 2007 through February 1, 2008. See Notes 1 and 2.