Dollar General 2007 Annual Report Download - page 31
Download and view the complete annual report
Please find page 31 of the 2007 Dollar General annual report below. You can navigate through the pages in the report by either clicking on the pages listed below, or by using the keyword search tool below to find specific information within the annual report.-
 1
1 -
2
-
3
-
4
-
5
-
6
-
7
-
8
-
9
-
10
-
11
-
12
-
13
-
14
-
15
-
16
-
17
-
18
-
19
-
20
-
 21
21 -
 22
22 -
 23
23 -
 24
24 -
 25
25 -
 26
26 -
 27
27 -
 28
28 -
 29
29 -
 30
30 -
 31
31 -
 32
32 -
 33
33 -
 34
34 -
 35
35 -
 36
36 -
 37
37 -
 38
38 -
 39
39 -
 40
40 -
 41
41 -
42
-
43
-
44
-
45
-
46
-
47
-
48
-
49
-
50
-
51
-
52
-
53
-
54
-
55
-
56
-
57
-
58
-
59
-
60
-
61
-
62
-
63
-
64
-
65
-
66
-
67
-
68
-
69
-
70
-
71
-
72
-
73
-
74
-
75
-
76
-
77
-
78
-
79
-
80
-
81
-
82
-
83
-
84
-
85
-
86
-
87
-
88
-
89
-
90
-
91
-
92
-
93
-
94
-
95
-
96
-
97
-
98
-
99
-
100
-
101
-
102
-
103
-
104
-
105
-
106
-
107
-
108
-
109
-
110
-
111
-
112
-
113
-
114
-
115
-
116
-
117
-
118
-
119
-
120
-
121
-
122
-
123
-
124
-
125
-
126
-
127
-
128
-
129
-
130
-
131
-
132
-
133
-
134
-
135
-
136
-
137
-
138
-
139
-
140
-
141
-
142
-
143
-
144
-
145
-
146
-
147
-
148
-
149
-
150
-
151
-
152
-
153
-
154
-
155
-
156
-
157
-
158
-
159
-
160
-
161
-
162
-
163
-
164
-
165
-
166
-
167
-
168
-
169
-
170
-
171
-
172
-
173
-
174
-
175
-
176
-
177
-
178
-
179
-
180
-
181
-
182
-
183
 |
 |

29
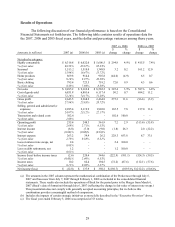
Results of Operations
The following discussion of our financial performance is based on the Consolidated
Financial Statements set forth herein. The following table contains results of operations data for
the 2007, 2006 and 2005 fiscal years, and the dollar and percentage variances among those years.
2007 vs. 2006 2006 vs. 2005
(amounts in millions) 2007 (a) 2006 (b) 2005 (c)
$
change
%
change
$
change
%
change
Net sales by category:
Highly consumable $ 6,316.8 $ 6,022.0 $ 5,606.5 $ 294.8 4.9% $ 415.5 7.4%
% of net sales 66.53% 65.67% 65.33%
Seasonal 1,513.2 1,510.0 1,348.8 3.2 0.2 161.2 12.0
% of net sales 15.94% 16.47% 15.72%
Home products 869.8 914.4 907.8 (44.6) (4.9) 6.5 0.7
% of net sales 9.16% 9.97% 10.58%
Basic clothing 795.4 723.5 719.2 72.0 9.9 4.3 0.6
% of net sales 8.38% 7.89% 8.38%
Net sales $ 9,495.2 $ 9,169.8 $ 8,582.2 $ 325.4 3.5% $ 587.6 6.8%
Cost of goods sold 6,851.8 6,801.6 6,117.4 50.2 0.7 684.2 11.2
% of net sales 72.16% 74.17% 71.28%
Gross profit 2,643.5 2,368.2 2,464.8 275.3 11.6 (96.6) (3.9)
% of net sales 27.84% 25.83% 28.72%
Selling, general and administrative
expenses 2,285.4 2,119.9 1,903.0 165.5 7.8 217.0 11.4
% of net sales 24.07% 23.12% 22.17%
Transaction and related costs 102.6 - - 102.6 100.0 - -
% of net sales 1.08% - - - -
Operating profit 255.4 248.3 561.9 7.2 2.9 (313.6) (55.8)
% of net sales 2.69% 2.71% 6.55%
Interest income (8.8) (7.0) (9.0) (1.8) 26.3 2.0 (22.2)
% of net sales (0.09)% (0.08)% (0.10)%
Interest expense 263.2 34.9 26.2 228.3 653.8 8.7 33.1
% of net sales 2.78% 0.38% 0.31%
Loss on interest rate swaps, net 2.4 - - 2.4 100.0 - -
% of net sales 0.03% - -
Loss on debt retirements, net 1.2 - - 1.2 100.0 - -
% of net sales 0.01% - -
Income (loss) before income taxes (2.6) 220.4 544.6 (222.9) (101.1) (324.3) (59.5)
% of net sales (0.03)% 2.40% 6.35%
Income taxes 10.2 82.4 194.5 (72.2) (87.6) (112.1) (57.6)
% of net sales 0.11% 0.90% 2.27%
Net income (loss) $ (12.8) $ 137.9 $ 350.2 $ (150.7) (109.3)
%
$ (212.2) (60.6)%
(a) The amounts in the 2007 column represent the mathematical combination of the Predecessor through July 6,
2007 and Successor from July 7, 2007 through February 1, 2008 as included in the consolidated financial
statements. These results also include the operations of Buck for the period prior to the Merger from March 6,
2007 (Buck’ s date of formation) through July 6, 2007 (reflecting the change in fair value of interest rate swaps.)
This presentation does not comply with generally accepted accounting principles, but we believe this
combination provides a meaningful method of comparison.
(b) Includes the impacts of certain strategic initiatives as more fully described in the “Executive Overview” above.
(c) The fiscal year ended February 3, 2006 was comprised of 53 weeks.