Dollar General 2007 Annual Report Download - page 58
Download and view the complete annual report
Please find page 58 of the 2007 Dollar General annual report below. You can navigate through the pages in the report by either clicking on the pages listed below, or by using the keyword search tool below to find specific information within the annual report.-
 1
1 -
2
-
3
-
4
-
5
-
6
-
7
-
8
-
9
-
10
-
11
-
12
-
13
-
14
-
15
-
16
-
17
-
18
-
19
-
20
-
21
-
22
-
23
-
24
-
25
-
26
-
27
-
28
-
29
-
30
-
31
-
32
-
33
-
34
-
35
-
36
-
37
-
38
-
39
-
40
-
41
-
42
-
43
-
44
-
45
-
46
-
47
-
 48
48 -
 49
49 -
 50
50 -
 51
51 -
 52
52 -
 53
53 -
 54
54 -
 55
55 -
 56
56 -
 57
57 -
 58
58 -
 59
59 -
 60
60 -
 61
61 -
 62
62 -
 63
63 -
 64
64 -
 65
65 -
 66
66 -
 67
67 -
 68
68 -
69
-
70
-
71
-
72
-
73
-
74
-
75
-
76
-
77
-
78
-
79
-
80
-
81
-
82
-
83
-
84
-
85
-
86
-
87
-
88
-
89
-
90
-
91
-
92
-
93
-
94
-
95
-
96
-
97
-
98
-
99
-
100
-
101
-
102
-
103
-
104
-
105
-
106
-
107
-
108
-
109
-
110
-
111
-
112
-
113
-
114
-
115
-
116
-
117
-
118
-
119
-
120
-
121
-
122
-
123
-
124
-
125
-
126
-
127
-
128
-
129
-
130
-
131
-
132
-
133
-
134
-
135
-
136
-
137
-
138
-
139
-
140
-
141
-
142
-
143
-
144
-
145
-
146
-
147
-
148
-
149
-
150
-
151
-
152
-
153
-
154
-
155
-
156
-
157
-
158
-
159
-
160
-
161
-
162
-
163
-
164
-
165
-
166
-
167
-
168
-
169
-
170
-
171
-
172
-
173
-
174
-
175
-
176
-
177
-
178
-
179
-
180
-
181
-
182
-
183
 |
 |

56
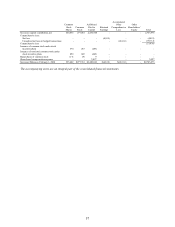
CONSOLIDATED STATEMENTS OF SHAREHOLDERS’ EQUITY
(In thousands except per share amounts)
Common
Stock
Shares
Common
Stock
Additional
Paid-in
Capital
Retained
Earnings
Accumulated
Other
Comprehensive
Loss
Other
Shareholders’
Equity Total
Predecessor Balances, January 28, 2005 328,172 $ 164,086 $ 421,600 $1,102,457 $ (973) $ (2,705) $1,684,465
Comprehensive income:
Net income - - - 350,155 - - 350,155
Reclassification of net loss on derivatives - - - - 179 - 179
Comprehensive income 350,334
Cash dividends, $0.175 per common share - - - (56,183) - - (56,183)
Issuance of common stock under stock
incentive plans 2,249 1,125 28,280 - - - 29,405
Tax benefit from stock option exercises - - 6,457 - - - 6,457
Repurchases of common stock (14,977) (7,489) - (290,113) - - (297,602)
Sales of common stock by employee deferred
compensation trust, net (42 shares) - - 95 - - 788 883
Issuance of restricted stock and restricted stock
units, net 249 125 5,151 - - (5,276) -
Amortization of unearned compensation on
restricted stock and restricted stock units - - - - - 2,394 2,394
Acceleration of vesting of stock options (see
Note 9) - - 938 - - - 938
Other equity transactions (14) (7) (138) (151) - - (296)
Predecessor Balances, February 3, 2006 315,679 $ 157,840 $ 462,383 $1,106,165 $ (794) $ (4,799) $1,720,795
Comprehensive income:
Net income - - - 137,943 - - 137,943
Reclassification of net loss on derivatives - - - - 188 - 188
Comprehensive income 138,131
Cash dividends, $0.20 per common share - - - (62,472) - - (62,472)
Issuance of common stock under stock
incentive plans 1,573 786 19,108 - - - 19,894
Tax benefit from share-based payments - - 2,513 - - - 2,513
Repurchases of common stock (4,483) (2,242) - (77,705) - - (79,947)
Purchases of common stock by employee
deferred compensation trust, net (3 shares) - - (2) - - 40 38
Reversal of unearned compensation upon
adoption of SFAS 123(R) (see Note 9) (364) (182) (4,997) - - 5,179 -
Share-based compensation expense - - 7,578 - - - 7,578
Vesting of restricted stock and restricted stock
units 149 75 (75) - - - -
Transition adjustment upon adoption of
SFAS 158 - - - - (381) - (381)
Other equity transactions (118) (59) (363) 20 - - (402)
Predecessor Balances, February 2, 2007 312,436 $ 156,218 $ 486,145 $1,103,951 $ (987) $ 420 $1,745,747
Adoption of FIN 48 - - - (8,917) - - (8,917)
Predecessor Balances as adjusted, February 2,
2007 312,436 156,218 486,145 1,095,034 (987) 420 1,736,830
Comprehensive income:
Net loss - - - (7,998) - - (7,998)
Reclassification of net loss on derivatives - - - - 76 - 76
Comprehensive loss - - - - - - (7,922)
Cash dividends, $0.05 per common share - - - (15,710) - - (15,710)
Issuance of common stock under stock
incentive plans 2,496 1,248 40,294 - - - 41,542
Tax benefit from stock option exercises - - 3,927 - - - 3,927
Share-based compensation expense - - 45,458 - - - 45,458
Vesting of restricted stock and restricted stock
units 126 63 (63) - - - -
Other equity transactions (28) (13) (580) (48) - 7 (634)
Elimination of Predecessor equity in
connection with Merger (see Notes 1 and 2) (315,030) (157,516) (575,181) (1,071,278) 911 (427) (1,803,491)
Predecessor Balances subsequent to Merger $ - $ - $ - $ - $ - $ - $ -