Dollar General 2007 Annual Report Download - page 25
Download and view the complete annual report
Please find page 25 of the 2007 Dollar General annual report below. You can navigate through the pages in the report by either clicking on the pages listed below, or by using the keyword search tool below to find specific information within the annual report.-
 1
1 -
2
-
3
-
4
-
5
-
6
-
7
-
8
-
9
-
10
-
11
-
12
-
13
-
14
-
 15
15 -
 16
16 -
 17
17 -
 18
18 -
 19
19 -
 20
20 -
 21
21 -
 22
22 -
 23
23 -
 24
24 -
 25
25 -
 26
26 -
 27
27 -
 28
28 -
 29
29 -
 30
30 -
 31
31 -
 32
32 -
 33
33 -
 34
34 -
 35
35 -
36
-
37
-
38
-
39
-
40
-
41
-
42
-
43
-
44
-
45
-
46
-
47
-
48
-
49
-
50
-
51
-
52
-
53
-
54
-
55
-
56
-
57
-
58
-
59
-
60
-
61
-
62
-
63
-
64
-
65
-
66
-
67
-
68
-
69
-
70
-
71
-
72
-
73
-
74
-
75
-
76
-
77
-
78
-
79
-
80
-
81
-
82
-
83
-
84
-
85
-
86
-
87
-
88
-
89
-
90
-
91
-
92
-
93
-
94
-
95
-
96
-
97
-
98
-
99
-
100
-
101
-
102
-
103
-
104
-
105
-
106
-
107
-
108
-
109
-
110
-
111
-
112
-
113
-
114
-
115
-
116
-
117
-
118
-
119
-
120
-
121
-
122
-
123
-
124
-
125
-
126
-
127
-
128
-
129
-
130
-
131
-
132
-
133
-
134
-
135
-
136
-
137
-
138
-
139
-
140
-
141
-
142
-
143
-
144
-
145
-
146
-
147
-
148
-
149
-
150
-
151
-
152
-
153
-
154
-
155
-
156
-
157
-
158
-
159
-
160
-
161
-
162
-
163
-
164
-
165
-
166
-
167
-
168
-
169
-
170
-
171
-
172
-
173
-
174
-
175
-
176
-
177
-
178
-
179
-
180
-
181
-
182
-
183
 |
 |

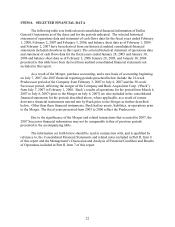
23
(Amounts in millions, excluding number of stores and net sales per square foot)
Predecessor
Successor Fiscal Year Ended
July 7, 2007
through
February 1,
2008 (1)
February 3,
2007
through
July 6, 2007
February 2,
2007 (2)
February 3,
2006 (3)
January 28,
2005
January 30,
2004
Statement of Operations Data:
Net sales $ 5,571.5 $ 3,923.8 $ 9,169.8 $ 8,582.2 $ 7,660.9 $ 6,872.0
Cost of goods sold 3,999.6 2,852.2 6,801.6 6,117.4 5,397.7 4,853.9
Gross profit 1,571.9 1,071.6 2,368.2 2,464.8 2,263.2 2,018.1
Selling, general and
administrative (4) 1,324.5 960.9 2,119.9 1,903.0 1,706.2 1,510.1
Transaction and related costs 1.2 101.4 - - - -
Operating profit 246.1 9.2 248.3 561.9 557.0 508.0
Interest income (3.8) (5.0) (7.0) (9.0) (6.6) (4.1)
Interest expense 252.9 10.3 34.9 26.2 28.8 35.6
Loss on interest rate swaps 2.4 - - - - -
Loss on debt retirement, net 1.2 - - - - -
Income (loss) before taxes (6.6) 4.0 220.4 544.6 534.8 476.5
Income tax expense (benefit) (1.8) 12.0 82.4 194.5 190.6 177.5
Net income (loss) $ (4.8) $ (8.0) $137.9 $350.2 $ 344.2 $299.0
Statement of Cash Flows Data:
Net cash provided by (used in):
Operating activities $ 239.6 $ 201.9 $ 405.4 $ 555.5 $ 391.5 $ 514.1
Investing activities (6,848.4) (66.9) (282.0) (264.4) (259.2) (256.7)
Financing activities 6,709.0 25.3 (134.7) (323.3) (245.4) (43.3)
Total capital expenditures (83.6) (56.2) (261.5) (284.1) (288.3) (140.1)
Other Financial and Operating
Data:
Same store sales growth 1.9% 2.6% 3.3% 2.2% 3.2% 4.0%
Number of stores (at period end) 8,194 8,205 8,229 7,929 7,320 6,700
Selling square feet (in thousands
at period end) 57,376 57,379 57,299 54,753 50,015 45,354
Net sales per square foot (5) $ 165.4 $ 163.9 $ 162.6 $ 159.8 $ 159.6 $ 157.5
Highly consumable sales 66.4% 66.7% 65.7% 65.3% 63.0% 61.2%
Seasonal sales 16.3% 15.4% 16.4% 15.7% 16.5% 16.8%
Home product sales 9.1% 9.2% 10.0% 10.6% 11.5% 12.5%
Basic clothing sales 8.2% 8.7% 7.9% 8.4% 9.0% 9.5%
Rent expense $ 214.5 $ 150.2 $ 343.9 $ 312.3 $ 268.8 $ 232.0
Balance Sheet Data (at period
end):
Cash and cash equivalents and short-
term investments $ 119.8 $ 219.2 $ 209.5 $ 275.8 $ 414.6
Total assets 8,656.4 3,040.5 2,980.3 2,841.0 2,621.1
Total debt 4,282.0 270.0 278.7 271.3 282.0
Total shareholders’ equity 2,703.9 1,745.7 1,720.8 1,684.5 1,554.3
(1) Includes the results of Buck for the period prior to the Merger with and into Dollar General Corporation from March 6, 2007 (its formation)
through July 6, 2007 and the post-Merger results of Dollar General Corporation for the period from July 7, 2007 through February 1, 2008.
(2) Includes the effects of certain strategic merchandising and real estate initiatives as further described in “Management’ s Discussion and
Analysis of Financial Condition and Results of Operations.”
(3) The fiscal year ended February 3, 2006 was comprised of 53 weeks
(4) Penalty expenses of $10 million in fiscal 2003 are included in SG&A.
(5) For the fiscal year ended February 3, 2006, net sales per square foot was calculated based on 52 weeks’ sales.