Dollar General 2007 Annual Report Download - page 9
Download and view the complete annual report
Please find page 9 of the 2007 Dollar General annual report below. You can navigate through the pages in the report by either clicking on the pages listed below, or by using the keyword search tool below to find specific information within the annual report.-
 1
1 -
 2
2 -
 3
3 -
 4
4 -
 5
5 -
 6
6 -
 7
7 -
 8
8 -
 9
9 -
 10
10 -
 11
11 -
 12
12 -
 13
13 -
 14
14 -
 15
15 -
 16
16 -
 17
17 -
 18
18 -
 19
19 -
 20
20 -
21
-
22
-
23
-
24
-
25
-
26
-
27
-
28
-
29
-
30
-
31
-
32
-
33
-
34
-
35
-
36
-
37
-
38
-
39
-
40
-
41
-
42
-
43
-
44
-
45
-
46
-
47
-
48
-
49
-
50
-
51
-
52
-
53
-
54
-
55
-
56
-
57
-
58
-
59
-
60
-
61
-
62
-
63
-
64
-
65
-
66
-
67
-
68
-
69
-
70
-
71
-
72
-
73
-
74
-
75
-
76
-
77
-
78
-
79
-
80
-
81
-
82
-
83
-
84
-
85
-
86
-
87
-
88
-
89
-
90
-
91
-
92
-
93
-
94
-
95
-
96
-
97
-
98
-
99
-
100
-
101
-
102
-
103
-
104
-
105
-
106
-
107
-
108
-
109
-
110
-
111
-
112
-
113
-
114
-
115
-
116
-
117
-
118
-
119
-
120
-
121
-
122
-
123
-
124
-
125
-
126
-
127
-
128
-
129
-
130
-
131
-
132
-
133
-
134
-
135
-
136
-
137
-
138
-
139
-
140
-
141
-
142
-
143
-
144
-
145
-
146
-
147
-
148
-
149
-
150
-
151
-
152
-
153
-
154
-
155
-
156
-
157
-
158
-
159
-
160
-
161
-
162
-
163
-
164
-
165
-
166
-
167
-
168
-
169
-
170
-
171
-
172
-
173
-
174
-
175
-
176
-
177
-
178
-
179
-
180
-
181
-
182
-
183
 |
 |

7
members of management pursuant to which they elected to invest in Dollar General in an
aggregate amount of approximately $10.4 million.
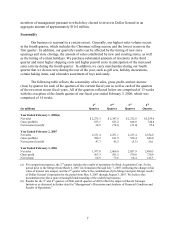
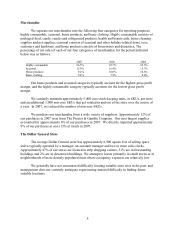
Seasonality
Our business is seasonal to a certain extent. Generally, our highest sales volume occurs
in the fourth quarter, which includes the Christmas selling season, and the lowest occurs in the
first quarter. In addition, our quarterly results can be affected by the timing of new store
openings and store closings, the amount of sales contributed by new and existing stores, as well
as the timing of certain holidays. We purchase substantial amounts of inventory in the third
quarter and incur higher shipping costs and higher payroll costs in anticipation of the increased
sales activity during the fourth quarter. In addition, we carry merchandise during our fourth
quarter that we do not carry during the rest of the year, such as gift sets, holiday decorations,
certain baking items, and a broader assortment of toys and candy.
The following table reflects the seasonality of net sales, gross profit, and net income
(loss) by quarter for each of the quarters of the current fiscal year as well as each of the quarters
of the two most recent fiscal years. All of the quarters reflected below are comprised of 13 weeks
with the exception of the fourth quarter of our fiscal year ended February 3, 2006, which was
comprised of 14 weeks.
(in millions)
1st
Quarter
2nd
Quarter
3rd
Quarter
4th
Quarter
Year Ended February 1, 2008(a)
Net sales $ 2,275.3 $ 2,347.6 $ 2,312.8 $2,559.6
Gross profit(b) 633.1 623.2 646.8 740.4
Net income (loss)(b) 34.9 (70.1) (33.0) 55.4
Year Ended February 2, 2007
Net sales 2,151.4 2,251.1 2,213.4 2,554.0
Gross profit(b) 584.3 611.5 526.4 646.0
Net income (loss)(b) 47.7 45.5 (5.3) 50.1
Year Ended February 3, 2006
Net sales 1,977.8 2,066.0 2,057.9 2,480.5
Gross profit 563.3 591.5 579.0 730.9
Net income 64.9 75.6 64.4 145.3
(a) For comparison purposes, the 2nd quarter includes the results of operations for Buck Acquisition Corp. for the
period prior to the Merger from March 6, 2007 (its formation) through July 7, 2007 (reflecting the change in fair
value of interest rate swaps), and the 2nd quarter reflects the combination of pre-Merger and post-Merger results
of Dollar General Corporation for the period from May 5, 2007 through August 3, 2007. We believe this
presentation provides a more meaningful understanding of the underlying business.
(b) Results for the 3rd and 4th quarters of 2006 and all quarters of 2007 reflect the impact of Recent Strategic
Initiatives as discussed in further detail in “Management’ s Discussion and Analysis of Financial Condition and
Results of Operations.”