Dollar General 2007 Annual Report Download - page 100
Download and view the complete annual report
Please find page 100 of the 2007 Dollar General annual report below. You can navigate through the pages in the report by either clicking on the pages listed below, or by using the keyword search tool below to find specific information within the annual report.-
 1
1 -
2
-
3
-
4
-
5
-
6
-
7
-
8
-
9
-
10
-
11
-
12
-
13
-
14
-
15
-
16
-
17
-
18
-
19
-
20
-
21
-
22
-
23
-
24
-
25
-
26
-
27
-
28
-
29
-
30
-
31
-
32
-
33
-
34
-
35
-
36
-
37
-
38
-
39
-
40
-
41
-
42
-
43
-
44
-
45
-
46
-
47
-
48
-
49
-
50
-
51
-
52
-
53
-
54
-
55
-
56
-
57
-
58
-
59
-
60
-
61
-
62
-
63
-
64
-
65
-
66
-
67
-
68
-
69
-
70
-
71
-
72
-
73
-
74
-
75
-
76
-
77
-
78
-
79
-
80
-
81
-
82
-
83
-
84
-
85
-
86
-
87
-
88
-
89
-
 90
90 -
 91
91 -
 92
92 -
 93
93 -
 94
94 -
 95
95 -
 96
96 -
 97
97 -
 98
98 -
 99
99 -
 100
100 -
 101
101 -
 102
102 -
 103
103 -
 104
104 -
 105
105 -
 106
106 -
 107
107 -
 108
108 -
 109
109 -
 110
110 -
111
-
112
-
113
-
114
-
115
-
116
-
117
-
118
-
119
-
120
-
121
-
122
-
123
-
124
-
125
-
126
-
127
-
128
-
129
-
130
-
131
-
132
-
133
-
134
-
135
-
136
-
137
-
138
-
139
-
140
-
141
-
142
-
143
-
144
-
145
-
146
-
147
-
148
-
149
-
150
-
151
-
152
-
153
-
154
-
155
-
156
-
157
-
158
-
159
-
160
-
161
-
162
-
163
-
164
-
165
-
166
-
167
-
168
-
169
-
170
-
171
-
172
-
173
-
174
-
175
-
176
-
177
-
178
-
179
-
180
-
181
-
182
-
183
 |
 |

98
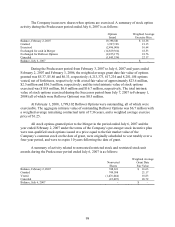
The Company issues new shares when options are exercised. A summary of stock option
activity during the Predecessor period ended July 6, 2007 is as follows:
Options
Issued
Weighted Average
Exercise Price
Balance, February 2, 2007 19,398,881 $ 18.38
Granted 1,997,198 21.15
Exercised (2,496,006) 16.64
Exchanged for cash in Merger (14,829,364) 18.53
Exchanged for Rollover Options (2,225,175) 18.76
Canceled (1,845,534) 22.17
Balance, July 6, 2007 - $ -
During the Predecessor period from February 3, 2007 to July 6, 2007 and years ended
February 2, 2007 and February 3, 2006, the weighted average grant date fair value of options
granted was $5.37, $5.86 and $6.33, respectively; 4,213,373, 617,234 and 8,281,184 options
vested, net of forfeitures, respectively; with a total fair value of approximately $23.6 million,
$2.5 million and $56.5 million, respectively; and the total intrinsic value of stock options
exercised was $10.8 million, $6.8 million and $16.7 million, respectively. The total intrinsic
value of stock options exercised during the Successor period from July 7, 2007 to February 1,
2008 (all of which were Rollover Options) was $0.5 million.
At February 1, 2008, 1,799,102 Rollover Options were outstanding, all of which were
exercisable. The aggregate intrinsic value of outstanding Rollover Options was $6.7 million with
a weighted average remaining contractual term of 7.36 years, and a weighted average exercise
price of $1.25.
All stock options granted prior to the Merger in the period ended July 6, 2007 and the
year ended February 2, 2007 under the terms of the Company’ s pre-merger stock incentive plan
were non-qualified stock options issued at a price equal to the fair market value of the
Company’ s common stock on the date of grant, were originally scheduled to vest ratably over a
four-year period, and were to expire 10 years following the date of grant.
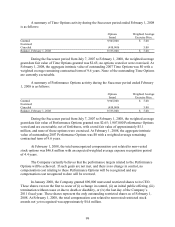
A summary of activity related to nonvested restricted stock and restricted stock unit
awards during the Predecessor period ended July 6, 2007 is as follows:
Nonvested
Shares
Weighted Average
Grant Date
Fair Value
Balance, February 2, 2007 748,631 $ 16.63
Granted 749,508 21.17
Vested (1,476,044) 18.83
Canceled (22,095) 20.72
Balance, July 6, 2007 - $ -