Dollar General 2007 Annual Report Download - page 45
Download and view the complete annual report
Please find page 45 of the 2007 Dollar General annual report below. You can navigate through the pages in the report by either clicking on the pages listed below, or by using the keyword search tool below to find specific information within the annual report.-
 1
1 -
2
-
3
-
4
-
5
-
6
-
7
-
8
-
9
-
10
-
11
-
12
-
13
-
14
-
15
-
16
-
17
-
18
-
19
-
20
-
21
-
22
-
23
-
24
-
25
-
26
-
27
-
28
-
29
-
30
-
31
-
32
-
33
-
34
-
 35
35 -
 36
36 -
 37
37 -
 38
38 -
 39
39 -
 40
40 -
 41
41 -
 42
42 -
 43
43 -
 44
44 -
 45
45 -
 46
46 -
 47
47 -
 48
48 -
 49
49 -
 50
50 -
 51
51 -
 52
52 -
 53
53 -
 54
54 -
 55
55 -
56
-
57
-
58
-
59
-
60
-
61
-
62
-
63
-
64
-
65
-
66
-
67
-
68
-
69
-
70
-
71
-
72
-
73
-
74
-
75
-
76
-
77
-
78
-
79
-
80
-
81
-
82
-
83
-
84
-
85
-
86
-
87
-
88
-
89
-
90
-
91
-
92
-
93
-
94
-
95
-
96
-
97
-
98
-
99
-
100
-
101
-
102
-
103
-
104
-
105
-
106
-
107
-
108
-
109
-
110
-
111
-
112
-
113
-
114
-
115
-
116
-
117
-
118
-
119
-
120
-
121
-
122
-
123
-
124
-
125
-
126
-
127
-
128
-
129
-
130
-
131
-
132
-
133
-
134
-
135
-
136
-
137
-
138
-
139
-
140
-
141
-
142
-
143
-
144
-
145
-
146
-
147
-
148
-
149
-
150
-
151
-
152
-
153
-
154
-
155
-
156
-
157
-
158
-
159
-
160
-
161
-
162
-
163
-
164
-
165
-
166
-
167
-
168
-
169
-
170
-
171
-
172
-
173
-
174
-
175
-
176
-
177
-
178
-
179
-
180
-
181
-
182
-
183
 |
 |
43
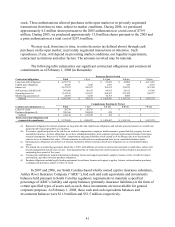
$150.8 million, as described in detail under “Results of Operations” above, and which is partially
attributable to $102.6 million of Transaction and related costs in 2007. Other significant
components of the change in cash flows from operating activities in 2007 as compared to 2006
were changes in inventory balances, which decreased by approximately 10% during 2007
compared to a decrease of approximately 3% during 2006. Inventory levels in the seasonal
category declined by $84.5 million, or 24%, in 2007 compared to a $6.7 million, or 2%, increase
in 2006. The highly consumable category declined by $42.4 million, or 6%, in 2007 compared to
a $63.2 million, or 10%, increase in 2006. The home products category increased by $3.5
million, or 2%, in 2007 as compared to a $52.5 million, or 25%, decline in 2006. The basic
clothing category decreased by $20.3 million, or 9%, in 2007 as compared to a $59.5 million, or
21%, decrease in 2006. In addition to inventory changes the decline in net income was a
principal factor in the reduction in income taxes paid in 2007 as compared to 2006. Also
offsetting the decline in net income were changes in accrued expenses in 2007 as compared to
2006, which increased primarily due to income tax related reserves, accrued interest, incentive
compensation accrual, the accrued loss in connection with the ongoing negotiations to restructure
our distribution center leases, and accruals for lease liabilities on closed stores.
Cash flows from operating activities for 2006 compared to 2005 declined by $150.1
million. The most significant component of the decline in cash flows from operating activities in
2006 as compared to 2005 was the reduction in net income, as described in detail under “Results
of Operations” above. Partially offsetting this decline are certain noncash charges included in net
income, including below-cost markdowns on inventory balances and property and equipment
impairment charges totaling $78.1 million, and a $13.8 million increase in noncash depreciation
and amortization charges in 2006 as compared to 2005. In addition, the reduction in 2006 year
end inventory balances reflect the effect of below-cost markdowns and our efforts to sell through
excess inventories, as compared with increases in 2005 and 2004. Seasonal inventory levels
increased by 2% in 2006 as compared to a 10% increase in 2005, home products inventory levels
declined by 25% in 2006 as compared to a 2% increase in 2005, while basic clothing inventory
levels declined by 21% in 2006 as compared to a 5% decline in 2005. Total merchandise
inventories at the end of 2006 were $1.43 billion compared to $1.47 billion at the end of 2005, a
2.9% decrease overall, and a 6.4% decrease on a per store basis, reflecting both our focus on
liquidating packaway merchandise and the effect of below-cost markdowns.
Cash flows from investing activities. The Merger, as discussed in more detail above,
required cash payments of approximately $6.7 billion, net of cash acquired of $350 million.
Significant components of property and equipment purchases in 2007 included the following
approximate amounts: $60 million for improvements, upgrades, remodels and relocations of
existing stores; $45 million for new stores; and $30 million for distribution and transportation-
related capital expenditures. During 2007, we opened 365 new stores and remodeled or relocated
300 stores.
During 2007 we purchased a secured promissory note for $37.0 million which represents
debt issued by a third-party entity from which we lease our distribution center in Ardmore,
Oklahoma. Purchases and sales of short-term investments in 2007, which equaled net sales of
$22.1 million, primarily reflect our investment activities in our captive insurance subsidiary, and
all purchases of long-term investments are related to the captive insurance subsidiary.