Dollar General 2007 Annual Report Download - page 109
Download and view the complete annual report
Please find page 109 of the 2007 Dollar General annual report below. You can navigate through the pages in the report by either clicking on the pages listed below, or by using the keyword search tool below to find specific information within the annual report.-
 1
1 -
2
-
3
-
4
-
5
-
6
-
7
-
8
-
9
-
10
-
11
-
12
-
13
-
14
-
15
-
16
-
17
-
18
-
19
-
20
-
21
-
22
-
23
-
24
-
25
-
26
-
27
-
28
-
29
-
30
-
31
-
32
-
33
-
34
-
35
-
36
-
37
-
38
-
39
-
40
-
41
-
42
-
43
-
44
-
45
-
46
-
47
-
48
-
49
-
50
-
51
-
52
-
53
-
54
-
55
-
56
-
57
-
58
-
59
-
60
-
61
-
62
-
63
-
64
-
65
-
66
-
67
-
68
-
69
-
70
-
71
-
72
-
73
-
74
-
75
-
76
-
77
-
78
-
79
-
80
-
81
-
82
-
83
-
84
-
85
-
86
-
87
-
88
-
89
-
90
-
91
-
92
-
93
-
94
-
95
-
96
-
97
-
98
-
 99
99 -
 100
100 -
 101
101 -
 102
102 -
 103
103 -
 104
104 -
 105
105 -
 106
106 -
 107
107 -
 108
108 -
 109
109 -
 110
110 -
 111
111 -
 112
112 -
 113
113 -
 114
114 -
 115
115 -
 116
116 -
 117
117 -
 118
118 -
 119
119 -
120
-
121
-
122
-
123
-
124
-
125
-
126
-
127
-
128
-
129
-
130
-
131
-
132
-
133
-
134
-
135
-
136
-
137
-
138
-
139
-
140
-
141
-
142
-
143
-
144
-
145
-
146
-
147
-
148
-
149
-
150
-
151
-
152
-
153
-
154
-
155
-
156
-
157
-
158
-
159
-
160
-
161
-
162
-
163
-
164
-
165
-
166
-
167
-
168
-
169
-
170
-
171
-
172
-
173
-
174
-
175
-
176
-
177
-
178
-
179
-
180
-
181
-
182
-
183
 |
 |

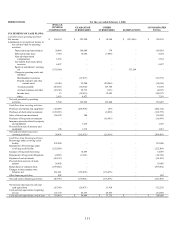
107
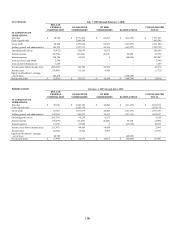
PREDECESSOR For the year ended February 2, 2007
DOLLAR
GENERAL
CORPORATION
GUARANTOR
SUBSIDIARIES
OTHER
SUBSIDIARIES ELIMINATIONS
CONSOLIDATED
TOTAL
STATEMENTS OF
OPERATIONS:
Net sales $ 165,463 $ 9,169,822 $ 107,383 $ (272,846) $ 9,169,822
Cost of goods sold - 6,801,617 - - 6,801,617
Gross profit 165,463 2,368,205 107,383
(272,846) 2,368,205
Selling, general and administrative 149,272 2,154,371 89,132
(272,846) 2,119,929
Operating profit 16,191 213,834 18,251
- 248,276
Interest income (126,628) (33,521) (11,543)
164,690 (7,002)
Interest expense 60,856 138,749 -
(164,690) 34,915
Income before income taxes 81,963 108,606 29,794
- 220,363
Income taxes 36,513 36,568 9,339
- 82,420
Equity in subsidiaries’ earnings,
net of taxes 92,493 -
-
(92,493) -
Net income $ 137,943 $ 72,038 $ 20,455 $ (92,493) $ 137,943
PREDECESSOR For the year ended February 3, 2006
DOLLAR
GENERAL
CORPORATION
GUARANTOR
SUBSIDIARIES
OTHER
SUBSIDIARIES ELIMINATIONS
CONSOLIDATED
TOTAL
STATEMENTS OF
OPERATIONS:
Net sales $ 162,805 $ 8,582,237 $ 184,889 $ (347,694) $ 8,582,237
Cost of goods sold - 6,117,413 - - 6,117,413
Gross profit 162,805 2,464,824 184,889
(347,694) 2,464,824
Selling, general and administrative 139,879 1,936,514 174,258
(347,694) 1,902,957
Operating profit 22,926 528,310 10,631
- 561,867
Interest income (97,005) (65,428) (3,504)
156,936 (9,001)
Interest expense 85,536 97,626 -
(156,936) 26,226
Income before income taxes 34,395 496,112 14,135
- 544,642
Income taxes 17,824 172,892 3,771
- 194,487
Equity in subsidiaries’ earnings,
net of taxes 333,584 -
-
(333,584) -
Net income $ 350,155 $ 323,220 $ 10,364 $ (333,584) $ 350,155