Dollar General 2007 Annual Report Download - page 28
Download and view the complete annual report
Please find page 28 of the 2007 Dollar General annual report below. You can navigate through the pages in the report by either clicking on the pages listed below, or by using the keyword search tool below to find specific information within the annual report.-
 1
1 -
2
-
3
-
4
-
5
-
6
-
7
-
8
-
9
-
10
-
11
-
12
-
13
-
14
-
15
-
16
-
17
-
 18
18 -
 19
19 -
 20
20 -
 21
21 -
 22
22 -
 23
23 -
 24
24 -
 25
25 -
 26
26 -
 27
27 -
 28
28 -
 29
29 -
 30
30 -
 31
31 -
 32
32 -
 33
33 -
 34
34 -
 35
35 -
 36
36 -
 37
37 -
 38
38 -
39
-
40
-
41
-
42
-
43
-
44
-
45
-
46
-
47
-
48
-
49
-
50
-
51
-
52
-
53
-
54
-
55
-
56
-
57
-
58
-
59
-
60
-
61
-
62
-
63
-
64
-
65
-
66
-
67
-
68
-
69
-
70
-
71
-
72
-
73
-
74
-
75
-
76
-
77
-
78
-
79
-
80
-
81
-
82
-
83
-
84
-
85
-
86
-
87
-
88
-
89
-
90
-
91
-
92
-
93
-
94
-
95
-
96
-
97
-
98
-
99
-
100
-
101
-
102
-
103
-
104
-
105
-
106
-
107
-
108
-
109
-
110
-
111
-
112
-
113
-
114
-
115
-
116
-
117
-
118
-
119
-
120
-
121
-
122
-
123
-
124
-
125
-
126
-
127
-
128
-
129
-
130
-
131
-
132
-
133
-
134
-
135
-
136
-
137
-
138
-
139
-
140
-
141
-
142
-
143
-
144
-
145
-
146
-
147
-
148
-
149
-
150
-
151
-
152
-
153
-
154
-
155
-
156
-
157
-
158
-
159
-
160
-
161
-
162
-
163
-
164
-
165
-
166
-
167
-
168
-
169
-
170
-
171
-
172
-
173
-
174
-
175
-
176
-
177
-
178
-
179
-
180
-
181
-
182
-
183
 |
 |
26
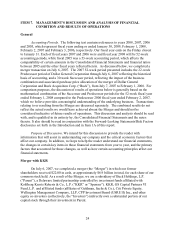
In November 2006, we completed a strategic review of our inventory and real estate
strategies and announced significant changes to existing company practices, which we refer to as
“Project Alpha.” At that time, we announced our decision to close 403 stores which did not meet
our recently developed store criteria, in addition to stores closed in the ordinary course of
business, and to slow our new store growth rate. We made this decision to allow ourselves to
focus on our merchandising efforts and improvements to our execution in the stores. At that
time, we also announced the decision to eliminate, with limited exceptions, our “packaway”
inventory strategy, which was our historical practice of storing unsold merchandise at the end of
a season and carrying it over to the following year. All of the 403 stores identified for closing
were closed by the end of July 2007, and all of our packaway inventory was eliminated by the
end of the 2007 fiscal year. We believe that the elimination of packaway inventory, coupled with
the completion in 2006 of the implementation of our EZstoreTM process (simplifying the way we
stock new merchandise in our stores), contributed to our ability to show significant
improvements in the shopability and manageability of our stores in 2007. We believe these
initiatives also led to our successful reduction of store employee turnover in 2007, including
significant improvement at the critical store manager and district manager levels.
In addition to the initiatives noted above, during 2007 we worked closely with KKR to
refine our strategic initiatives and set goals to improve our operational and financial
performance. During this transition, we slowed our store growth, as planned, and we defined
very specific operational and financial benchmarks to monitor and measure our progress against
our goals. Specifically, in 2007, we focused on and made good progress on improving our
merchandising and category management processes, refining our real estate processes and
improving our distribution and transportation logistics. In addition, we accelerated our efforts to
refine our pricing strategy, increase direct foreign sourcing and expand our private label offering.
All of these initiatives are ongoing and we continue to expect them to positively impact our gross
profit, sales productivity and capital efficiency in 2008 and beyond.
It is important for you to read our more detailed discussion of financial and operating
results below under “Results of Operations.” Basis points or “bps” amounts referred to below are
equal to 0.01 percent as a percentage of sales. Some of the more significant highlights of the
2007 fiscal year are as follows:
• Total sales increased 3.5%, including a 2.1% increase in same-store sales compared
with the prior year. The remaining sales increase resulted from new stores, partially
offset by the impact of closed stores.
• Gross profit, as a percentage of sales, increased to 27.8% compared to 25.8% in 2006.
This increase was the result of improved purchase markups, decreased markdowns,
and leverage on distribution costs impacted by improved logistics. The 2006 gross
profit rate was significantly impacted by merchandise markdowns as a result of our
inventory liquidation and store closing activities.
• SG&A, as a percentage of sales, increased to 24.1% compared to 23.1%. Several
items of significance affected this comparison, including: the addition of leasehold
intangibles amortization (non-cash) of 25 bps; an excess of Project Alpha-related