Dollar General 2007 Annual Report Download - page 107
Download and view the complete annual report
Please find page 107 of the 2007 Dollar General annual report below. You can navigate through the pages in the report by either clicking on the pages listed below, or by using the keyword search tool below to find specific information within the annual report.-
 1
1 -
2
-
3
-
4
-
5
-
6
-
7
-
8
-
9
-
10
-
11
-
12
-
13
-
14
-
15
-
16
-
17
-
18
-
19
-
20
-
21
-
22
-
23
-
24
-
25
-
26
-
27
-
28
-
29
-
30
-
31
-
32
-
33
-
34
-
35
-
36
-
37
-
38
-
39
-
40
-
41
-
42
-
43
-
44
-
45
-
46
-
47
-
48
-
49
-
50
-
51
-
52
-
53
-
54
-
55
-
56
-
57
-
58
-
59
-
60
-
61
-
62
-
63
-
64
-
65
-
66
-
67
-
68
-
69
-
70
-
71
-
72
-
73
-
74
-
75
-
76
-
77
-
78
-
79
-
80
-
81
-
82
-
83
-
84
-
85
-
86
-
87
-
88
-
89
-
90
-
91
-
92
-
93
-
94
-
95
-
96
-
 97
97 -
 98
98 -
 99
99 -
 100
100 -
 101
101 -
 102
102 -
 103
103 -
 104
104 -
 105
105 -
 106
106 -
 107
107 -
 108
108 -
 109
109 -
 110
110 -
 111
111 -
 112
112 -
 113
113 -
 114
114 -
 115
115 -
 116
116 -
 117
117 -
118
-
119
-
120
-
121
-
122
-
123
-
124
-
125
-
126
-
127
-
128
-
129
-
130
-
131
-
132
-
133
-
134
-
135
-
136
-
137
-
138
-
139
-
140
-
141
-
142
-
143
-
144
-
145
-
146
-
147
-
148
-
149
-
150
-
151
-
152
-
153
-
154
-
155
-
156
-
157
-
158
-
159
-
160
-
161
-
162
-
163
-
164
-
165
-
166
-
167
-
168
-
169
-
170
-
171
-
172
-
173
-
174
-
175
-
176
-
177
-
178
-
179
-
180
-
181
-
182
-
183
 |
 |

105
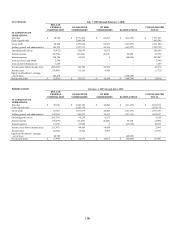
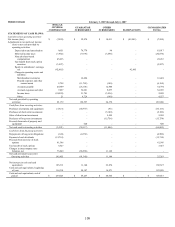
PREDECESSOR As of February 2, 2007
DOLLAR
GENERAL
CORPORATION
GUARANTOR
SUBSIDIARIES
OTHER
SUBSIDIARIES ELIMINATIONS
CONSOLIDATED
TOTAL
BALANCE SHEET:
ASSETS
Current assets:
Cash and cash equivalents $ 114,310 $ 58,107 $ 16,871 $ - $ 189,288
Short-term investments - - 29,950
-
29,950
Merchandise inventories - 1,432,336 -
-
1,432,336
Income tax receivable 4,884 4,949 -
-
9,833
Deferred income taxes 7,422 13,482 3,417
-
24,321
Prepaid expenses and other
current assets 139,913
928,854
166,468
(1,178,215)
57,020
Total current assets 266,529 2,437,728 216,706
(1,178,215) 1,742,748
Net property and equipment 98,580 1,137,710 584
-
1,236,874
Deferred income taxes 581 - 5,536
(6,117)
-
Other assets, net 2,693,030 23,489 20,133
(2,675,760) 60,892
Total assets $ 3,058,720 $ 3,598,927 $ 242,959 $ (3,860,092) $ 3,040,514
LIABILITIES AND
SHAREHOLDERS’ EQUITY
Current liabilities:
Current portion of long-term
obligations $ -
$ 8,080
$-
$-
$ 8,080
Accounts payable 1,084,460 577,443 69,710 (1,176,339) 555,274
Accrued expenses and other 13,327 241,849 258 (1,876) 253,558
Income taxes payable - 6,453 9,506 - 15,959
Total current liabilities 1,097,787 833,825 79,474 (1,178,215) 832,871
Long-term obligations 199,842 1,584,526 - (1,522,410) 261,958
Deferred income taxes - 47,714 - (6,117) 41,597
Other non-current liabilities 15,344 35,521 107,476 - 158,341
Shareholders’ equity:
Preferred stock - - - - -
Common stock 156,218 23,753 100 (23,853) 156,218
Additional paid-in capital 486,145 653,711 19,900 (673,611) 486,145
Retained earnings 1,103,951 419,877 36,009 (455,886) 1,103,951
Accumulated other
comprehensive loss (987)
-
-
-
(987)
Other shareholders’ equity 420 - - - 420
Total shareholders’ equity 1,745,747 1,097,341 56,009 (1,153,350) 1,745,747
Total liabilities and shareholders’
equity $ 3,058,720
$ 3,598,927
$ 242,959
$ (3,860,092)
$ 3,040,514