Dollar General 2007 Annual Report Download - page 66
Download and view the complete annual report
Please find page 66 of the 2007 Dollar General annual report below. You can navigate through the pages in the report by either clicking on the pages listed below, or by using the keyword search tool below to find specific information within the annual report.-
 1
1 -
2
-
3
-
4
-
5
-
6
-
7
-
8
-
9
-
10
-
11
-
12
-
13
-
14
-
15
-
16
-
17
-
18
-
19
-
20
-
21
-
22
-
23
-
24
-
25
-
26
-
27
-
28
-
29
-
30
-
31
-
32
-
33
-
34
-
35
-
36
-
37
-
38
-
39
-
40
-
41
-
42
-
43
-
44
-
45
-
46
-
47
-
48
-
49
-
50
-
51
-
52
-
53
-
54
-
55
-
 56
56 -
 57
57 -
 58
58 -
 59
59 -
 60
60 -
 61
61 -
 62
62 -
 63
63 -
 64
64 -
 65
65 -
 66
66 -
 67
67 -
 68
68 -
 69
69 -
 70
70 -
 71
71 -
 72
72 -
 73
73 -
 74
74 -
 75
75 -
 76
76 -
77
-
78
-
79
-
80
-
81
-
82
-
83
-
84
-
85
-
86
-
87
-
88
-
89
-
90
-
91
-
92
-
93
-
94
-
95
-
96
-
97
-
98
-
99
-
100
-
101
-
102
-
103
-
104
-
105
-
106
-
107
-
108
-
109
-
110
-
111
-
112
-
113
-
114
-
115
-
116
-
117
-
118
-
119
-
120
-
121
-
122
-
123
-
124
-
125
-
126
-
127
-
128
-
129
-
130
-
131
-
132
-
133
-
134
-
135
-
136
-
137
-
138
-
139
-
140
-
141
-
142
-
143
-
144
-
145
-
146
-
147
-
148
-
149
-
150
-
151
-
152
-
153
-
154
-
155
-
156
-
157
-
158
-
159
-
160
-
161
-
162
-
163
-
164
-
165
-
166
-
167
-
168
-
169
-
170
-
171
-
172
-
173
-
174
-
175
-
176
-
177
-
178
-
179
-
180
-
181
-
182
-
183
 |
 |

64
Predecessor
February 2, 2007
Held-to-
Maturity
Securities
Available-
for-Sale
Securities
Trading
Securities
Cash and cash equivalents $ 79,764 $ 13,512 $ -
Short-term investments 29,950 - -
Prepaid expenses and other current assets - - 1,090
Other assets, net 19,723 - 12,501
$ 129,437 $ 13,512 $ 13,591
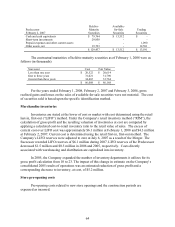
The contractual maturities of held-to-maturity securities as of February 1, 2008 were as
follows (in thousands):
Successor Cost Fair Value
Less than one year $ 20,522 $ 20,614
One to three years 31,021 31,790
Greater than three years 34,465 33,764
$ 86,008 $ 86,168
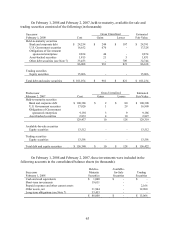
For the years ended February 1, 2008, February 2, 2007 and February 3, 2006, gross
realized gains and losses on the sales of available-for-sale securities were not material. The cost
of securities sold is based upon the specific identification method.
Merchandise inventories
Inventories are stated at the lower of cost or market with cost determined using the retail
last-in, first-out (“LIFO”) method. Under the Company’ s retail inventory method (“RIM”), the
calculation of gross profit and the resulting valuation of inventories at cost are computed by
applying a calculated cost-to-retail inventory ratio to the retail value of sales. The excess of
current cost over LIFO cost was approximately $6.1 million at February 1, 2008 and $4.3 million
at February 2, 2007. Current cost is determined using the retail first-in, first-out method. The
Company’ s LIFO reserves were adjusted to zero at July 6, 2007 as a result of the Merger. The
Successor recorded LIFO reserves of $6.1 million during 2007. LIFO reserves of the Predecessor
decreased $1.5 million and $0.5 million in 2006 and 2005, respectively. Costs directly
associated with warehousing and distribution are capitalized into inventory.
In 2005, the Company expanded the number of inventory departments it utilizes for its
gross profit calculation from 10 to 23. The impact of this change in estimate on the Company’ s
consolidated 2005 results of operations was an estimated reduction of gross profit and a
corresponding decrease to inventory, at cost, of $5.2 million.
Store pre-opening costs
Pre-opening costs related to new store openings and the construction periods are
expensed as incurred.