Dollar General 2007 Annual Report Download - page 77
Download and view the complete annual report
Please find page 77 of the 2007 Dollar General annual report below. You can navigate through the pages in the report by either clicking on the pages listed below, or by using the keyword search tool below to find specific information within the annual report.-
 1
1 -
2
-
3
-
4
-
5
-
6
-
7
-
8
-
9
-
10
-
11
-
12
-
13
-
14
-
15
-
16
-
17
-
18
-
19
-
20
-
21
-
22
-
23
-
24
-
25
-
26
-
27
-
28
-
29
-
30
-
31
-
32
-
33
-
34
-
35
-
36
-
37
-
38
-
39
-
40
-
41
-
42
-
43
-
44
-
45
-
46
-
47
-
48
-
49
-
50
-
51
-
52
-
53
-
54
-
55
-
56
-
57
-
58
-
59
-
60
-
61
-
62
-
63
-
64
-
65
-
66
-
 67
67 -
 68
68 -
 69
69 -
 70
70 -
 71
71 -
 72
72 -
 73
73 -
 74
74 -
 75
75 -
 76
76 -
 77
77 -
 78
78 -
 79
79 -
 80
80 -
 81
81 -
 82
82 -
 83
83 -
 84
84 -
 85
85 -
 86
86 -
 87
87 -
88
-
89
-
90
-
91
-
92
-
93
-
94
-
95
-
96
-
97
-
98
-
99
-
100
-
101
-
102
-
103
-
104
-
105
-
106
-
107
-
108
-
109
-
110
-
111
-
112
-
113
-
114
-
115
-
116
-
117
-
118
-
119
-
120
-
121
-
122
-
123
-
124
-
125
-
126
-
127
-
128
-
129
-
130
-
131
-
132
-
133
-
134
-
135
-
136
-
137
-
138
-
139
-
140
-
141
-
142
-
143
-
144
-
145
-
146
-
147
-
148
-
149
-
150
-
151
-
152
-
153
-
154
-
155
-
156
-
157
-
158
-
159
-
160
-
161
-
162
-
163
-
164
-
165
-
166
-
167
-
168
-
169
-
170
-
171
-
172
-
173
-
174
-
175
-
176
-
177
-
178
-
179
-
180
-
181
-
182
-
183
 |
 |

75
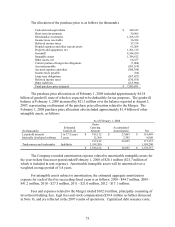
The allocation of the purchase price is as follows (in thousands):
Cash and cash equivalents $ 349,615
Short-term investments 30,906
Merchandise inventories 1,368,130
Income taxes receivable 36,934
Deferred income taxes 57,176
Prepaid expenses and other current assets 63,204
Property and equipment, net 1,301,119
Goodwill 4,344,930
Intangible assets 1,396,612
Other assets, net 66,537
Current portion of long-term obligations (7,088)
Accounts payable (585,518)
Accrued expenses and other (306,394)
Income taxes payable (84)
Long-term obligations (267,927)
Deferred income taxes (536,555)
Other liabilities (215,906)
Total purchase price assigned $ 7,095,691
The purchase price allocation as of February 1, 2008 included approximately $4.34
billion of goodwill, none of which is expected to be deductible for tax purposes. The goodwill
balance at February 1, 2008 increased by $21.3 million over the balance reported at August 3,
2007, representing a refinement of the purchase price allocation related to the Merger. The
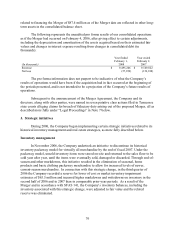
February 1, 2008 purchase price allocation also included approximately $1.4 billion of other
intangible assets, as follows:
As of February 1, 2008
(In thousands)
Estimated
Useful Life
Gross
Carrying
Amount
Accumulated
Amortization Net
Leasehold interests 2 to 17.5 years $ 185,112 $ 23,663 $ 161,449
Internally developed software 3 years 12,300 2,392 9,908
197,412 26,055 171,357
Trade names and trademarks Indefinite 1,199,200 - 1,199,200
$ 1,396,612 $ 26,055 $ 1,370,557
The Company recorded amortization expense related to amortizable intangible assets for
the year-to-date Successor period ended February 1, 2008 of $26.1 million ($23.7 million of
which is included in rent expense). Amortizable intangible assets will be amortized over a
weighted average period of 5.4 years.
For intangible assets subject to amortization, the estimated aggregate amortization
expense for each of the five succeeding fiscal years is as follows: 2008 - $44.7 million, 2009 -
$41.2 million, 2010 - $27.3 million, 2011 - $21.0 million, 2012 - $17.1 million.
Fees and expenses related to the Merger totaled $102.6 million, principally consisting of
investment banking fees, legal fees and stock compensation ($39.4 million as further discussed
in Note 9), and are reflected in the 2007 results of operations. Capitalized debt issuance costs,