Cablevision 2012 Annual Report Download - page 99
Download and view the complete annual report
Please find page 99 of the 2012 Cablevision annual report below. You can navigate through the pages in the report by either clicking on the pages listed below, or by using the keyword search tool below to find specific information within the annual report.-
 1
1 -
2
-
3
-
4
-
5
-
6
-
7
-
8
-
9
-
10
-
11
-
12
-
13
-
14
-
15
-
16
-
17
-
18
-
19
-
20
-
21
-
22
-
23
-
24
-
25
-
26
-
27
-
28
-
29
-
30
-
31
-
32
-
33
-
34
-
35
-
36
-
37
-
38
-
39
-
40
-
41
-
42
-
43
-
44
-
45
-
46
-
47
-
48
-
49
-
50
-
51
-
52
-
53
-
54
-
55
-
56
-
57
-
58
-
59
-
60
-
61
-
62
-
63
-
64
-
65
-
66
-
67
-
68
-
69
-
70
-
71
-
72
-
73
-
74
-
75
-
76
-
77
-
78
-
79
-
80
-
81
-
82
-
83
-
84
-
85
-
86
-
87
-
88
-
 89
89 -
 90
90 -
 91
91 -
 92
92 -
 93
93 -
 94
94 -
 95
95 -
 96
96 -
 97
97 -
 98
98 -
 99
99 -
 100
100 -
 101
101 -
 102
102 -
 103
103 -
 104
104 -
 105
105 -
 106
106 -
 107
107 -
 108
108 -
 109
109 -
110
-
111
-
112
-
113
-
114
-
115
-
116
-
117
-
118
-
119
-
120
-
121
-
122
-
123
-
124
-
125
-
126
-
127
-
128
-
129
-
130
-
131
-
132
-
133
-
134
-
135
-
136
-
137
-
138
-
139
-
140
-
141
-
142
-
143
-
144
-
145
-
146
-
147
-
148
-
149
-
150
-
151
-
152
-
153
-
154
-
155
-
156
-
157
-
158
-
159
-
160
-
161
-
162
-
163
-
164
-
165
-
166
-
167
-
168
-
169
-
170
-
171
-
172
-
173
-
174
-
175
-
176
-
177
-
178
-
179
-
180
-
181
-
182
-
183
-
184
-
185
-
186
-
187
-
188
-
189
-
190
-
191
-
192
-
193
-
194
-
195
-
196
-
197
-
198
-
199
-
200
-
201
-
202
-
203
-
204
-
205
-
206
-
207
-
208
-
209
-
210
-
211
-
212
-
213
-
214
-
215
-
216
-
217
-
218
-
219
-
220
 |
 |

(93)
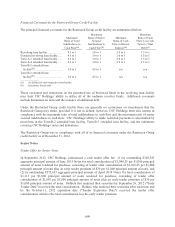
The maturity, number of shares deliverable at the relevant maturity, hedge price per share, and the lowest
and highest cap prices received for each security monetized via an equity derivative prepaid forward
contract are summarized in the following table:
# of Shares Hedge Price Cap Price(b)
Security Deliverable Maturity per Share(a) Low High
Comcast
13,407,684 (c) 2013 $20.52-$24.94 $24.63 $29.92
8,069,934 2014 $28.89-$34.03 $37.56 $44.24
________________
(a) Represents the price below which we are provided with downside protection and above which we retain upside
appreciation. Also represents the price used in determining the cash proceeds payable to us at inception of the
contracts.
(b) Represents the price up to which we receive the benefit of stock price appreciation.
(c) Includes an equity derivative contract at December 31, 2012 related to 2,668,875 shares that matured and was
settled on January 23, 2013 from the proceeds of a new monetization contract covering an equivalent number of
shares.
Fair Value of Debt: Based on the level of interest rates prevailing at December 31, 2012, the fair value of
our fixed rate debt of $7,754,543 was more than its carrying value of $7,051,061 by $703,482. The fair
value of these financial instruments is estimated based on reference to quoted market prices for these or
comparable securities. Our floating rate borrowings bear interest in reference to current LIBOR-based
market rates and thus their carrying values approximate fair value. The effect of a hypothetical 100 basis
point decrease in interest rates prevailing at December 31, 2012 would increase the estimated fair value of
our fixed rate debt by $391,192 to $8,145,735. This estimate is based on the assumption of an immediate
and parallel shift in interest rates across all maturities.
Interest Rate Swap Contracts: Our exposure to interest rate movements results from our use of floating
and fixed rate debt to fund our working capital, capital expenditures, acquisitions, a special dividend in
2006, and other operational and investment requirements. To manage interest rate risk, from time to time
we have entered into interest rate swap contracts to adjust the proportion of total debt that is subject to
variable and fixed interest rates. Such contracts effectively fix the borrowing rates on floating rate debt to
limit the exposure against the risk of rising rates and/or effectively convert fixed rate borrowings to
variable rates to permit the Company to realize lower interest expense in a declining interest rate
environment. We do not enter into interest rate swap contracts for speculative or trading purposes. We
monitor the financial institutions that are counterparties to our interest rate swap contracts and we only
enter into interest rate swap contracts with financial institutions that are rated investment grade. We
diversify our swap contracts among various counterparties to mitigate exposure to any single financial
institution. All such contracts are carried at their fair values on our consolidated balance sheets, with
changes in fair value reflected in our consolidated statements of income.
As of December 31, 2011 and through their maturity date in June 2012, CSC Holdings was party to
several interest rate swap contracts with an aggregate notional amount of $2,600,000 that effectively fixed
borrowing rates on a portion of our floating rate debt. The contracts were not designated as hedges for
accounting purposes.