Cablevision 2012 Annual Report Download - page 61
Download and view the complete annual report
Please find page 61 of the 2012 Cablevision annual report below. You can navigate through the pages in the report by either clicking on the pages listed below, or by using the keyword search tool below to find specific information within the annual report.-
 1
1 -
2
-
3
-
4
-
5
-
6
-
7
-
8
-
9
-
10
-
11
-
12
-
13
-
14
-
15
-
16
-
17
-
18
-
19
-
20
-
21
-
22
-
23
-
24
-
25
-
26
-
27
-
28
-
29
-
30
-
31
-
32
-
33
-
34
-
35
-
36
-
37
-
38
-
39
-
40
-
41
-
42
-
43
-
44
-
45
-
46
-
47
-
48
-
49
-
50
-
 51
51 -
 52
52 -
 53
53 -
 54
54 -
 55
55 -
 56
56 -
 57
57 -
 58
58 -
 59
59 -
 60
60 -
 61
61 -
 62
62 -
 63
63 -
 64
64 -
 65
65 -
 66
66 -
 67
67 -
 68
68 -
 69
69 -
 70
70 -
 71
71 -
72
-
73
-
74
-
75
-
76
-
77
-
78
-
79
-
80
-
81
-
82
-
83
-
84
-
85
-
86
-
87
-
88
-
89
-
90
-
91
-
92
-
93
-
94
-
95
-
96
-
97
-
98
-
99
-
100
-
101
-
102
-
103
-
104
-
105
-
106
-
107
-
108
-
109
-
110
-
111
-
112
-
113
-
114
-
115
-
116
-
117
-
118
-
119
-
120
-
121
-
122
-
123
-
124
-
125
-
126
-
127
-
128
-
129
-
130
-
131
-
132
-
133
-
134
-
135
-
136
-
137
-
138
-
139
-
140
-
141
-
142
-
143
-
144
-
145
-
146
-
147
-
148
-
149
-
150
-
151
-
152
-
153
-
154
-
155
-
156
-
157
-
158
-
159
-
160
-
161
-
162
-
163
-
164
-
165
-
166
-
167
-
168
-
169
-
170
-
171
-
172
-
173
-
174
-
175
-
176
-
177
-
178
-
179
-
180
-
181
-
182
-
183
-
184
-
185
-
186
-
187
-
188
-
189
-
190
-
191
-
192
-
193
-
194
-
195
-
196
-
197
-
198
-
199
-
200
-
201
-
202
-
203
-
204
-
205
-
206
-
207
-
208
-
209
-
210
-
211
-
212
-
213
-
214
-
215
-
216
-
217
-
218
-
219
-
220
 |
 |

(55)
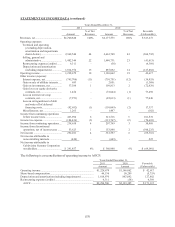
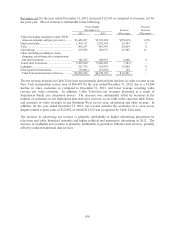
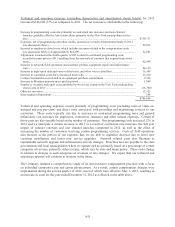
Technical and operating expenses (excluding depreciation, amortization and impairments) in 2012
increased $355,115 (12%) as compared to 2011. The net increase is attributable to the following:
Increase in expenses of the Telecommunications Services segment (including incremental costs of
$59,013 incurred as a result of Superstorm Sandy) ............................................................................ $346,608
Increase in expenses of the Other segment ............................................................................................ 8,953
Inter-segment eliminations .................................................................................................................... (446)
$355,115
As a percentage of revenues, technical and operating expenses increased 6% in 2012 as compared to
2011.
Selling, general and administrative expenses include primarily sales, marketing and advertising expenses,
administrative costs, and costs of customer call centers. Selling, general and administrative expenses
increased $61,765 (4%) for 2012 as compared to 2011. The net increase is attributable to the following:
Increase in expenses of the Telecommunications Services segment (including incremental costs of
$15,338 incurred as a result of Superstorm Sandy) ........................................................................... $ 73,819
Decrease in expenses of the Other segment .......................................................................................... (13,260)
Inter-segment eliminations ................................................................................................................... 1,206
$ 61,765
As a percentage of revenues, selling, general and administrative expenses increased 1% in 2012 as
compared to 2011.
Depreciation and amortization (including impairments) increased $63,983 (6%) for 2012 as compared to
2011. The net increase is attributable to the following:
Increase in expenses of the Telecommunications Services segment (including $1,462 related assets
damaged beyond repair in Superstorm Sandy) .................................................................................. $53,978
Increase in expenses of the Other segment ........................................................................................... 10,005
$63,983
Adjusted operating cash flow decreased $395,180 (17%) for the year ended December 31, 2012 as
compared to the same period in 2011. The net decrease is attributable to the following:
Decrease in AOCF of the Telecommunications Services segment (including a decrease of
$107,588 related to Superstorm Sandy) .............................................................................................. $(392,746)
Decrease in AOCF of the Other segment .............................................................................................. (2,434)
$(395,180)
Interest expense, net decreased $26,035 (3%) for 2012 as compared to 2011. The net decrease is
attributable to the following:
Decrease due to lower average interest rates on our indebtedness ....................................................... $(28,235)
Net increase due to change in average debt balances ........................................................................... 3,061
Higher interest income ........................................................................................................................... (140)
Other net decreases ............................................................................................................................... (721)
$(26,035)
See "Liquidity and Capital Resources" discussion below for a detail of our borrower groups.
Gain on sale of affiliate interests of $716 and $683 for the years ended December 31, 2012 and 2011,
respectively, relate to the installment sale of our ownership interest in PVI Virtual Media Services LLC
("PVI").