Cablevision 2012 Annual Report Download - page 64
Download and view the complete annual report
Please find page 64 of the 2012 Cablevision annual report below. You can navigate through the pages in the report by either clicking on the pages listed below, or by using the keyword search tool below to find specific information within the annual report.-
 1
1 -
2
-
3
-
4
-
5
-
6
-
7
-
8
-
9
-
10
-
11
-
12
-
13
-
14
-
15
-
16
-
17
-
18
-
19
-
20
-
21
-
22
-
23
-
24
-
25
-
26
-
27
-
28
-
29
-
30
-
31
-
32
-
33
-
34
-
35
-
36
-
37
-
38
-
39
-
40
-
41
-
42
-
43
-
44
-
45
-
46
-
47
-
48
-
49
-
50
-
51
-
52
-
53
-
 54
54 -
 55
55 -
 56
56 -
 57
57 -
 58
58 -
 59
59 -
 60
60 -
 61
61 -
 62
62 -
 63
63 -
 64
64 -
 65
65 -
 66
66 -
 67
67 -
 68
68 -
 69
69 -
 70
70 -
 71
71 -
 72
72 -
 73
73 -
 74
74 -
75
-
76
-
77
-
78
-
79
-
80
-
81
-
82
-
83
-
84
-
85
-
86
-
87
-
88
-
89
-
90
-
91
-
92
-
93
-
94
-
95
-
96
-
97
-
98
-
99
-
100
-
101
-
102
-
103
-
104
-
105
-
106
-
107
-
108
-
109
-
110
-
111
-
112
-
113
-
114
-
115
-
116
-
117
-
118
-
119
-
120
-
121
-
122
-
123
-
124
-
125
-
126
-
127
-
128
-
129
-
130
-
131
-
132
-
133
-
134
-
135
-
136
-
137
-
138
-
139
-
140
-
141
-
142
-
143
-
144
-
145
-
146
-
147
-
148
-
149
-
150
-
151
-
152
-
153
-
154
-
155
-
156
-
157
-
158
-
159
-
160
-
161
-
162
-
163
-
164
-
165
-
166
-
167
-
168
-
169
-
170
-
171
-
172
-
173
-
174
-
175
-
176
-
177
-
178
-
179
-
180
-
181
-
182
-
183
-
184
-
185
-
186
-
187
-
188
-
189
-
190
-
191
-
192
-
193
-
194
-
195
-
196
-
197
-
198
-
199
-
200
-
201
-
202
-
203
-
204
-
205
-
206
-
207
-
208
-
209
-
210
-
211
-
212
-
213
-
214
-
215
-
216
-
217
-
218
-
219
-
220
 |
 |

(58)
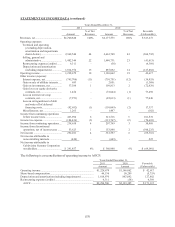
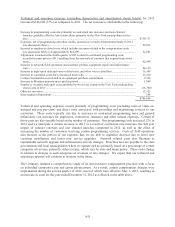
The following table summarizes service outage credits which reduced revenues, net, incremental costs,
depreciation and capital expenditures related to Superstorm Sandy for the year ended December 31, 2012:
Revenues, net ........................................................................................................................................ $ 33,237
Operating expenses:
Technical and operating expenses ..................................................................................................... 59,013
Selling, general and administrative expenses .................................................................................... 15,338
Impact to AOCF ................................................................................................................................... 107,588
Depreciation ...................................................................................................................................... 1,462
Impact to operating income .................................................................................................................. $109,050
Capital Expenditures ............................................................................................................................. $ 5,639
Revenues, net
Following the storm, we offered a credit to all customers who were without service (including cases
where the loss of service was due to a loss of electric power) and who contacted us to request a credit.
We have recorded a reduction to revenue of approximately $33,237 which primarily relates to these
customer credits for service outages in 2012 (including credits we expect to issue to customers who have
yet to contact us as of December 31, 2012). Additional credits are expected to be issued for service
outages that continue into 2013.
Technical and Operating Expenses
Technical and operating expenses incurred as a result of Superstorm Sandy include salaries resulting from
incremental overtime and premium pay, payroll taxes and benefits of approximately $28,084, repairs and
maintenance costs of approximately $41,209 and other costs of $2,300, partially offset by a reduction of
programming and other costs of approximately $12,580.
Selling, General and Administrative Expenses
Selling, general and administrative expenses incurred as a result of Superstorm Sandy include primarily
salaries resulting from incremental overtime and premium pay, payroll taxes and benefits of
approximately $13,745 and other costs of approximately $1,593.
Depreciation
Depreciation includes charges related to assets that were damaged beyond repair as a result of Superstorm
Sandy.
Capital Expenditures
Capital expenditures of $5,639 related to Superstorm Sandy include replacement of various segments of
our network and the purchase of equipment necessary to expedite restoration of service.
The table above summarizes incremental costs and service outage credits and therefore does not include
various other negative financial impacts to our business resulting from Superstorm Sandy, including
lower revenue related to customers for whom we decided to temporarily suspend billing during the
restoration of their homes, displaced homes and advertising cancelations.