Cablevision 2012 Annual Report Download - page 46
Download and view the complete annual report
Please find page 46 of the 2012 Cablevision annual report below. You can navigate through the pages in the report by either clicking on the pages listed below, or by using the keyword search tool below to find specific information within the annual report.-
 1
1 -
2
-
3
-
4
-
5
-
6
-
7
-
8
-
9
-
10
-
11
-
12
-
13
-
14
-
15
-
16
-
17
-
18
-
19
-
20
-
21
-
22
-
23
-
24
-
25
-
26
-
27
-
28
-
29
-
30
-
31
-
32
-
33
-
34
-
35
-
 36
36 -
 37
37 -
 38
38 -
 39
39 -
 40
40 -
 41
41 -
 42
42 -
 43
43 -
 44
44 -
 45
45 -
 46
46 -
 47
47 -
 48
48 -
 49
49 -
 50
50 -
 51
51 -
 52
52 -
 53
53 -
 54
54 -
 55
55 -
 56
56 -
57
-
58
-
59
-
60
-
61
-
62
-
63
-
64
-
65
-
66
-
67
-
68
-
69
-
70
-
71
-
72
-
73
-
74
-
75
-
76
-
77
-
78
-
79
-
80
-
81
-
82
-
83
-
84
-
85
-
86
-
87
-
88
-
89
-
90
-
91
-
92
-
93
-
94
-
95
-
96
-
97
-
98
-
99
-
100
-
101
-
102
-
103
-
104
-
105
-
106
-
107
-
108
-
109
-
110
-
111
-
112
-
113
-
114
-
115
-
116
-
117
-
118
-
119
-
120
-
121
-
122
-
123
-
124
-
125
-
126
-
127
-
128
-
129
-
130
-
131
-
132
-
133
-
134
-
135
-
136
-
137
-
138
-
139
-
140
-
141
-
142
-
143
-
144
-
145
-
146
-
147
-
148
-
149
-
150
-
151
-
152
-
153
-
154
-
155
-
156
-
157
-
158
-
159
-
160
-
161
-
162
-
163
-
164
-
165
-
166
-
167
-
168
-
169
-
170
-
171
-
172
-
173
-
174
-
175
-
176
-
177
-
178
-
179
-
180
-
181
-
182
-
183
-
184
-
185
-
186
-
187
-
188
-
189
-
190
-
191
-
192
-
193
-
194
-
195
-
196
-
197
-
198
-
199
-
200
-
201
-
202
-
203
-
204
-
205
-
206
-
207
-
208
-
209
-
210
-
211
-
212
-
213
-
214
-
215
-
216
-
217
-
218
-
219
-
220
 |
 |

(40)
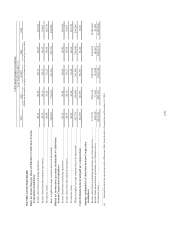
Statistical Data (Unaudited):
New York Metropolitan Service Area Optimum West Service Area Total (f)
As of December 31,
2012(g) 2011 2010 2012 2011 2010(a) 2012(g) 2011 2010
(in thousands, except per customer amounts)
Customer relationships(b) ......................................................................... 3,230 3,255 3,298 370 356 350 3,601 3,611 3,648
Video customers(c).................................................................................... 2,893 2,947 3,008 304 303 306 3,197 3,250 3,314
High-speed data customers ........................................................................ 2,763 2,701 2,653 292 264 239 3,055 2,965 2,892
Voice customers ........................................................................................ 2,264 2,201 2,138 170 156 131 2,433 2,357 2,269
Serviceable passings(d) ............................................................................ 4,979 4,922 4,882 667 662 650 5,646 5,584 5,532
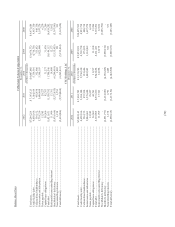
Penetration:
Customers relationships to serviceable passings .................................. 64.9% 66.1% 67.6% 55.5% 53.7% 53.8% 63.8% 64.7% 65.9%
Video customers to serviceable passings .............................................. 58.1% 59.9% 61.6% 45.6% 45.7% 47.1% 56.6% 58.2% 59.9%
High-speed data customers to serviceable passings .............................. 55.5% 54.9% 54.3% 43.8% 39.9% 36.8% 54.1% 53.1% 52.3%
Voice customers to serviceable passings ............................................... 45.5% 44.7% 43.8% 25.4% 23.5% 20.2% 43.1% 42.2% 41.0%
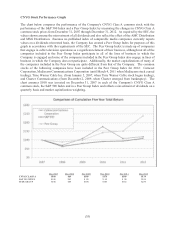
Average Monthly Revenue per Customer Relationship ("RPC")(e)... $137.51 $141.37 $137.73 $118.84 $114.85 N/A $135.61 $138.77 N/A
Average Monthly Revenue per Video Customer ("RPS")(e)............... $153.22 $156.09 $150.68 $143.99 $134.60 N/A $152.35 $154.10 N/A
________________
N/A Not meaningful.
(a) Reflects data related to Bresnan Cable, which was acquired by the Company on December 14, 2010.
(b) Represents number of households/businesses that receive at least one of the Company's services (see footnote (g) below).
(c) Video customers represent each customer account (set up and segregated by customer name and address), weighted equally and counted as one customer, regardless of size, revenue generated,
or number of boxes, units, or outlets. In calculating the number of customers, we count all customers other than inactive/disconnected customers (see footnote (g) below). Free accounts are
included in the customer counts along with all active accounts, but they are limited to a prescribed group such as our current and retired employees. Most of these accounts are also not entirely
free, as they typically generate revenue through pay-per-view or other pay services. Free status is not granted to regular customers as a promotion. We count a bulk commercial customer, such
as a hotel, as one customer, and do not count individual room units at that hotel. In counting bulk residential customers, such as an apartment building, we count each subscribing family unit
within the building as one customer, but do not count the master account for the entire building as a customer.
(d) Represents the estimated number of single residence homes, apartment and condominium units and commercial establishments passed by the cable distribution network in areas serviceable
without further extending the transmission lines.
(e) RPC is calculated by dividing the average monthly U.S. generally accepted accounting principles ("GAAP") revenues for the Telecommunications Services segment, less the revenue
attributable to Lightpath, for the fourth quarter of each year presented by the average number of customer relationships served by our cable television systems for the same period. RPS is
calculated using these same revenues divided by the average number of video customers for the respective periods. For purposes of this calculation, both revenue and average number of video
customers exclude our Lightpath operations because Lightpath's third-party revenues are unrelated to our cable television system customers.
(f) The sum of the customer data by service area may not equal the total amount presented due to rounding.
(g) Amounts exclude customers that were located in the areas most severely impacted by Superstorm Sandy who we have been unable to contact and those whose billing we have decided to
suspend temporarily during restoration of their homes. These customers represent approximately 11 thousand customer relationships, 10 thousand video, 9 thousand high-speed data and
7 thousand voice. Because of Superstorm Sandy, we suspended our normal collection efforts and non-pay disconnect policy. As a result, the customer information in the table above includes
delinquent customer accounts that exceed our normal disconnect timeline. Of these delinquent accounts, we estimated the number of accounts that we believe will be disconnected in 2013 as
our normal collection and disconnect procedures resume and our customer counts as of December 31, 2012 have been reduced accordingly (27 thousand customer relationships, 24 thousand
video, 23 thousand high-speed data and 19 thousand voice).