Cablevision 2012 Annual Report Download - page 83
Download and view the complete annual report
Please find page 83 of the 2012 Cablevision annual report below. You can navigate through the pages in the report by either clicking on the pages listed below, or by using the keyword search tool below to find specific information within the annual report.-
 1
1 -
2
-
3
-
4
-
5
-
6
-
7
-
8
-
9
-
10
-
11
-
12
-
13
-
14
-
15
-
16
-
17
-
18
-
19
-
20
-
21
-
22
-
23
-
24
-
25
-
26
-
27
-
28
-
29
-
30
-
31
-
32
-
33
-
34
-
35
-
36
-
37
-
38
-
39
-
40
-
41
-
42
-
43
-
44
-
45
-
46
-
47
-
48
-
49
-
50
-
51
-
52
-
53
-
54
-
55
-
56
-
57
-
58
-
59
-
60
-
61
-
62
-
63
-
64
-
65
-
66
-
67
-
68
-
69
-
70
-
71
-
72
-
 73
73 -
 74
74 -
 75
75 -
 76
76 -
 77
77 -
 78
78 -
 79
79 -
 80
80 -
 81
81 -
 82
82 -
 83
83 -
 84
84 -
 85
85 -
 86
86 -
 87
87 -
 88
88 -
 89
89 -
 90
90 -
 91
91 -
 92
92 -
 93
93 -
94
-
95
-
96
-
97
-
98
-
99
-
100
-
101
-
102
-
103
-
104
-
105
-
106
-
107
-
108
-
109
-
110
-
111
-
112
-
113
-
114
-
115
-
116
-
117
-
118
-
119
-
120
-
121
-
122
-
123
-
124
-
125
-
126
-
127
-
128
-
129
-
130
-
131
-
132
-
133
-
134
-
135
-
136
-
137
-
138
-
139
-
140
-
141
-
142
-
143
-
144
-
145
-
146
-
147
-
148
-
149
-
150
-
151
-
152
-
153
-
154
-
155
-
156
-
157
-
158
-
159
-
160
-
161
-
162
-
163
-
164
-
165
-
166
-
167
-
168
-
169
-
170
-
171
-
172
-
173
-
174
-
175
-
176
-
177
-
178
-
179
-
180
-
181
-
182
-
183
-
184
-
185
-
186
-
187
-
188
-
189
-
190
-
191
-
192
-
193
-
194
-
195
-
196
-
197
-
198
-
199
-
200
-
201
-
202
-
203
-
204
-
205
-
206
-
207
-
208
-
209
-
210
-
211
-
212
-
213
-
214
-
215
-
216
-
217
-
218
-
219
-
220
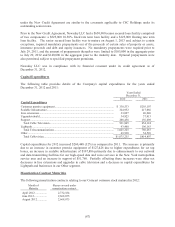
 |
 |

(77)
Net cash provided by operating activities of discontinued operations amounted to $129,114 for the year
ended December 31, 2011 compared to $306,893 for the year ended December 31, 2010. The 2011 cash
provided by operating activities resulted from income of $103,808 before depreciation and amortization
(including impairments), $206,610 of non-cash items, and an $841 increase in accounts payable and
accrued liabilities. Partially offsetting these increases was a decrease in cash of $131,642 resulting from
the acquisition of and payment of obligations relating to program rights and a $50,503 increase in current
and other assets.
Net cash provided by operating activities of discontinued operations amounted to $306,893 for the year
ended December 31, 2010 and resulted from income of $266,902 before depreciation and amortization,
non-cash items of $379,238 and a decrease in current and other assets of $9,343. Partially offsetting these
increases were decreases in cash of $305,215 resulting from the acquisition of and payment of obligations
relating to program rights and a decrease in accounts payable and other liabilities of $43,375.
Investing Activities
Net cash used in investing activities of discontinued operations for the year ended December 31, 2011
was $4,086 compared to $22,591 for the year ended December 31, 2010. The 2011 investing activities
consisted of capital expenditures of $4,340, partially offset by other net cash receipts of $254.
Net cash used in investing activities of discontinued operations for the year ended December 31, 2010
was $22,591 and consisted of capital expenditures of $23,240, partially offset by other net cash receipts of
$649.
Financing Activities
Net cash provided by financing activities of discontinued operations for the year ended December 31,
2011 was $2,857 compared to net cash used in financing activities of $207,670 for the year ended
December 31, 2010. The 2011 financing activities consisted primarily of net proceeds from credit facility
debt of $667,364, partially offset by the repayment and repurchase of $638,365 of senior notes, additions
to deferred financing costs of $23,900 and payments on capital lease obligations of $2,242.
Net cash used in financing activities of discontinued operations for the year ended December 31, 2010
was $207,670 and consisted of the repayment of a note payable to Madison Square Garden of $190,000,
net repayments of credit facility debt of $105,000, additions to deferred financing of $8,069 and payments
on capital lease obligations of $4,215, partially offset by net contributions from Cablevision of $99,614.
LIQUIDITY AND CAPITAL RESOURCES
Cablevision
Cablevision has no operations independent of its subsidiaries. Cablevision's outstanding securities consist
of Cablevision NY Group ("CNYG") Class A common stock, CNYG Class B common stock and
approximately $3,654,000 of debt securities, including approximately $2,900,000 face value of debt
securities held by third party investors and approximately $754,000 held by Newsday Holdings LLC.
The $754,000 of notes are eliminated in Cablevision's consolidated financial statements and are shown as
senior notes due from Cablevision in the consolidated equity of CSC Holdings.
Funding for Our Debt Service Requirements
Funding for the debt service requirements of our debt securities is provided by our subsidiaries'
operations, principally CSC Holdings, as permitted by the covenants governing CSC Holdings' credit
agreements and indentures. Funding for our subsidiaries is generally provided by cash flow from