Cablevision 2012 Annual Report Download - page 141
Download and view the complete annual report
Please find page 141 of the 2012 Cablevision annual report below. You can navigate through the pages in the report by either clicking on the pages listed below, or by using the keyword search tool below to find specific information within the annual report.-
 1
1 -
2
-
3
-
4
-
5
-
6
-
7
-
8
-
9
-
10
-
11
-
12
-
13
-
14
-
15
-
16
-
17
-
18
-
19
-
20
-
21
-
22
-
23
-
24
-
25
-
26
-
27
-
28
-
29
-
30
-
31
-
32
-
33
-
34
-
35
-
36
-
37
-
38
-
39
-
40
-
41
-
42
-
43
-
44
-
45
-
46
-
47
-
48
-
49
-
50
-
51
-
52
-
53
-
54
-
55
-
56
-
57
-
58
-
59
-
60
-
61
-
62
-
63
-
64
-
65
-
66
-
67
-
68
-
69
-
70
-
71
-
72
-
73
-
74
-
75
-
76
-
77
-
78
-
79
-
80
-
81
-
82
-
83
-
84
-
85
-
86
-
87
-
88
-
89
-
90
-
91
-
92
-
93
-
94
-
95
-
96
-
97
-
98
-
99
-
100
-
101
-
102
-
103
-
104
-
105
-
106
-
107
-
108
-
109
-
110
-
111
-
112
-
113
-
114
-
115
-
116
-
117
-
118
-
119
-
120
-
121
-
122
-
123
-
124
-
125
-
126
-
127
-
128
-
129
-
130
-
 131
131 -
 132
132 -
 133
133 -
 134
134 -
 135
135 -
 136
136 -
 137
137 -
 138
138 -
 139
139 -
 140
140 -
 141
141 -
 142
142 -
 143
143 -
 144
144 -
 145
145 -
 146
146 -
 147
147 -
 148
148 -
 149
149 -
 150
150 -
 151
151 -
152
-
153
-
154
-
155
-
156
-
157
-
158
-
159
-
160
-
161
-
162
-
163
-
164
-
165
-
166
-
167
-
168
-
169
-
170
-
171
-
172
-
173
-
174
-
175
-
176
-
177
-
178
-
179
-
180
-
181
-
182
-
183
-
184
-
185
-
186
-
187
-
188
-
189
-
190
-
191
-
192
-
193
-
194
-
195
-
196
-
197
-
198
-
199
-
200
-
201
-
202
-
203
-
204
-
205
-
206
-
207
-
208
-
209
-
210
-
211
-
212
-
213
-
214
-
215
-
216
-
217
-
218
-
219
-
220
 |
 |

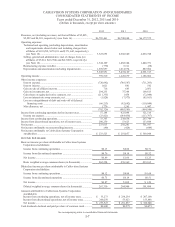
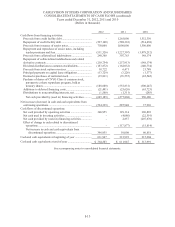
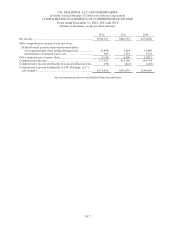
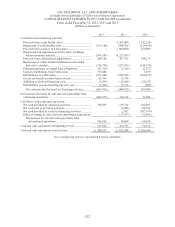
CABLEVISION SYSTEMS CORPORATION AND SUBSIDIARIES
CONSOLIDATED STATEMENTS OF CASH FLOWS (continued)
Years ended December 31, 2012, 2011 and 2010
(Dollars in thousands)
I-13
2012 2011 2010
Cash flows from financing activities:
Proceeds from credit facility debt ......................................... - 1,265,000 1,552,350
Repayment of credit facility debt .......................................... (527,108) (588,301) (514,638)
Proceeds from issuance of senior notes ................................. 750,000 1,000,000 1,500,000
Repayment and repurchase of senior notes, including
tender premiums and fees .................................................. (531,326) (1,227,307) (1,078,212)
Proceeds from collateralized indebtedness ........................... 248,388 307,763 148,174
Repayment of collateralized indebtedness and related
derivative contracts ............................................................... (218,754) (257,913) (148,174)
Dividend distributions to common stockholders ................... (163,872) (162,032) (140,734)
Proceeds from stock option exercises ................................... 18,722 6,471 21,788
Principal payments on capital lease obligations .................... (13,729) (3,226) (1,377)
Deemed repurchases of restricted stock ................................ (19,831) (35,555) (22,542)
Purchase of shares of CNYG Class A common stock,
pursuant to a share repurchase program, held as
treasury shares ................................................................... (188,600) (555,831) (300,247)
Additions to deferred financing costs.................................... (21,491) (25,626) (65,723)
Distributions to noncontrolling interests, net ........................ (1,588) (1,311) (285)
Net cash provided by (used in) financing activities ........... (669,189) (277,868) 950,380
Net increase (decrease) in cash and cash equivalents from
continuing operations ............................................................ (594,399) 287,948 37,969
Cash flows of discontinued operations:
Net cash provided by operating activities ............................. 346,955 129,114 306,893
Net cash used in investing activities ..................................... - (4,086) (22,591)
Net cash provided by (used in) financing activities .............. - 2,857 (207,670)
Effect of change in cash related to discontinued
operations .......................................................................... - (117,877) (15,814)
Net increase in cash and cash equivalents from
discontinued operations ................................................. 346,955 10,008 60,818
Cash and cash equivalents at beginning of year ....................... 611,947 313,991 215,204
Cash and cash equivalents at end of year ................................. $ 364,503 $ 611,947 $ 313,991
See accompanying notes to consolidated financial statements.