Cablevision 2012 Annual Report Download - page 69
Download and view the complete annual report
Please find page 69 of the 2012 Cablevision annual report below. You can navigate through the pages in the report by either clicking on the pages listed below, or by using the keyword search tool below to find specific information within the annual report.-
 1
1 -
2
-
3
-
4
-
5
-
6
-
7
-
8
-
9
-
10
-
11
-
12
-
13
-
14
-
15
-
16
-
17
-
18
-
19
-
20
-
21
-
22
-
23
-
24
-
25
-
26
-
27
-
28
-
29
-
30
-
31
-
32
-
33
-
34
-
35
-
36
-
37
-
38
-
39
-
40
-
41
-
42
-
43
-
44
-
45
-
46
-
47
-
48
-
49
-
50
-
51
-
52
-
53
-
54
-
55
-
56
-
57
-
58
-
 59
59 -
 60
60 -
 61
61 -
 62
62 -
 63
63 -
 64
64 -
 65
65 -
 66
66 -
 67
67 -
 68
68 -
 69
69 -
 70
70 -
 71
71 -
 72
72 -
 73
73 -
 74
74 -
 75
75 -
 76
76 -
 77
77 -
 78
78 -
 79
79 -
80
-
81
-
82
-
83
-
84
-
85
-
86
-
87
-
88
-
89
-
90
-
91
-
92
-
93
-
94
-
95
-
96
-
97
-
98
-
99
-
100
-
101
-
102
-
103
-
104
-
105
-
106
-
107
-
108
-
109
-
110
-
111
-
112
-
113
-
114
-
115
-
116
-
117
-
118
-
119
-
120
-
121
-
122
-
123
-
124
-
125
-
126
-
127
-
128
-
129
-
130
-
131
-
132
-
133
-
134
-
135
-
136
-
137
-
138
-
139
-
140
-
141
-
142
-
143
-
144
-
145
-
146
-
147
-
148
-
149
-
150
-
151
-
152
-
153
-
154
-
155
-
156
-
157
-
158
-
159
-
160
-
161
-
162
-
163
-
164
-
165
-
166
-
167
-
168
-
169
-
170
-
171
-
172
-
173
-
174
-
175
-
176
-
177
-
178
-
179
-
180
-
181
-
182
-
183
-
184
-
185
-
186
-
187
-
188
-
189
-
190
-
191
-
192
-
193
-
194
-
195
-
196
-
197
-
198
-
199
-
200
-
201
-
202
-
203
-
204
-
205
-
206
-
207
-
208
-
209
-
210
-
211
-
212
-
213
-
214
-
215
-
216
-
217
-
218
-
219
-
220
 |
 |

(63)
Other
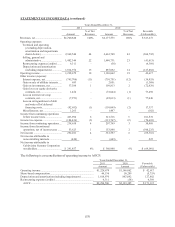
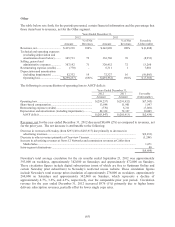
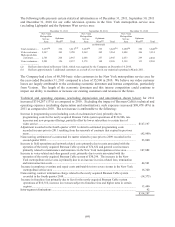
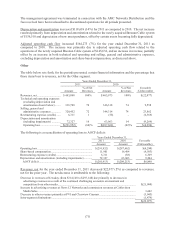
The table below sets forth, for the periods presented, certain financial information and the percentage that
those items bear to revenues, net for the Other segment.
Years Ended December 31,
2012 2011
Amount
% of Net
Revenues Amount
% of Net
Revenues
Favorable
(Unfavorable)
Revenues, net ................................. $ 435,210 100% $ 443,898 100% $ (8,688)
Technical and operating expenses
(excluding depreciation and
amortization shown below) ........ 345,713 79 336,760 76 (8,953)
Selling, general and
administrative expenses ............. 307,192 71 320,452 72 13,260
Restructuring expense (credits) ..... (770) - 6,311 1 7,081
Depreciation and amortization
(including impairments) ............ 82,332 19 72,327 16 (10,005)
Operating loss ............................ $(299,257) (69)% $(291,952) (66)% $ (7,305)
The following is a reconciliation of operating loss to AOCF deficit:
Years Ended December 31,
2012 2011 Favorable
Amount Amount (Unfavorable)
Operating loss ...........................................................................
.
$(299,257) $(291,952) $(7,305)
Share-based compensation ........................................................
.
13,848 11,901 1,947
Restructuring expense (credits) .................................................
.
(770) 6,311 (7,081)
Depreciation and amortization (including impairments) ...........
.
82,332 72,327 10,005
AOCF deficit .........................................................................
.
$(203,847) $(201,413) $(2,434)
Revenues, net for the year ended December 31, 2012 decreased $8,688 (2%) as compared to revenues, net
for the prior year. The net decrease is attributable to the following:
Decrease in revenues at Newsday (from $293,148 to $283,917) due primarily to decreases in
advertising revenues ..........................................................................................................................
.
$(9,231)
Decrease in other revenues primarily at Clearview Cinemas ...............................................................
.
(1,208)
Increase in advertising revenues at News 12 Networks and commission revenues at Cablevision
Media Sales .......................................................................................................................................
.
1,671
Intra-segment eliminations ...................................................................................................................
.
80
$(8,688)
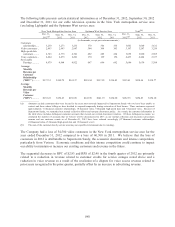
Newsday's total average circulation for the six months ended September 23, 2012 was approximately
393,000 on weekdays, approximately 382,000 on Saturdays and approximately 472,000 on Sundays.
These circulation figures include digital subscriptions (most of which are free to Optimum Online and
certain Newsday print subscribers) to Newsday's restricted access website. These circulation figures
include Newsday's total average print circulation of approximately 278,000 on weekdays, approximately
268,000 on Saturdays and approximately 342,000 on Sundays, which represents a decline of
approximately 4.7%, 3.6%, and 4.3%, respectively, over the comparable prior year period. Circulation
revenue for the year ended December 31, 2012 increased $976 (1%) primarily due to higher home
delivery subscription revenues, partially offset by lower single copy sales.