Cablevision 2012 Annual Report Download - page 187
Download and view the complete annual report
Please find page 187 of the 2012 Cablevision annual report below. You can navigate through the pages in the report by either clicking on the pages listed below, or by using the keyword search tool below to find specific information within the annual report.-
 1
1 -
2
-
3
-
4
-
5
-
6
-
7
-
8
-
9
-
10
-
11
-
12
-
13
-
14
-
15
-
16
-
17
-
18
-
19
-
20
-
21
-
22
-
23
-
24
-
25
-
26
-
27
-
28
-
29
-
30
-
31
-
32
-
33
-
34
-
35
-
36
-
37
-
38
-
39
-
40
-
41
-
42
-
43
-
44
-
45
-
46
-
47
-
48
-
49
-
50
-
51
-
52
-
53
-
54
-
55
-
56
-
57
-
58
-
59
-
60
-
61
-
62
-
63
-
64
-
65
-
66
-
67
-
68
-
69
-
70
-
71
-
72
-
73
-
74
-
75
-
76
-
77
-
78
-
79
-
80
-
81
-
82
-
83
-
84
-
85
-
86
-
87
-
88
-
89
-
90
-
91
-
92
-
93
-
94
-
95
-
96
-
97
-
98
-
99
-
100
-
101
-
102
-
103
-
104
-
105
-
106
-
107
-
108
-
109
-
110
-
111
-
112
-
113
-
114
-
115
-
116
-
117
-
118
-
119
-
120
-
121
-
122
-
123
-
124
-
125
-
126
-
127
-
128
-
129
-
130
-
131
-
132
-
133
-
134
-
135
-
136
-
137
-
138
-
139
-
140
-
141
-
142
-
143
-
144
-
145
-
146
-
147
-
148
-
149
-
150
-
151
-
152
-
153
-
154
-
155
-
156
-
157
-
158
-
159
-
160
-
161
-
162
-
163
-
164
-
165
-
166
-
167
-
168
-
169
-
170
-
171
-
172
-
173
-
174
-
175
-
176
-
 177
177 -
 178
178 -
 179
179 -
 180
180 -
 181
181 -
 182
182 -
 183
183 -
 184
184 -
 185
185 -
 186
186 -
 187
187 -
 188
188 -
 189
189 -
 190
190 -
 191
191 -
 192
192 -
 193
193 -
 194
194 -
 195
195 -
 196
196 -
 197
197 -
198
-
199
-
200
-
201
-
202
-
203
-
204
-
205
-
206
-
207
-
208
-
209
-
210
-
211
-
212
-
213
-
214
-
215
-
216
-
217
-
218
-
219
-
220
 |
 |

COMBINED NOTES TO CONSOLIDATED FINANCIAL STATEMENTS (continued)
(Dollars in thousands, except per share amounts)
I-59
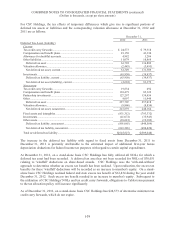
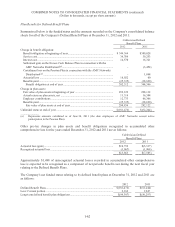
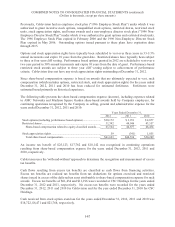
For CSC Holdings, the tax effects of temporary differences which give rise to significant portions of
deferred tax assets or liabilities and the corresponding valuation allowance at December 31, 2012 and
2011 are as follows:
December 31,
2012 2011
Deferred Tax Asset (Liability)
Current
Tax credit carry forwards .................................................................................... $ 24,573 $ 79,318
Compensation and benefit plans ......................................................................... 23,158 41,330
Allowance for doubtful accounts ........................................................................ 4,982 5,286
Other liabilities .................................................................................................... 11,079 10,868
Deferred tax asset ............................................................................................ 63,792 136,802
Valuation allowance ............................................................................................ (2,443) (5,493)
Net deferred tax asset, current ......................................................................... 61,349 131,309
Investments ......................................................................................................... (63,950) (39,937)
Deferred tax liability, current .......................................................................... (63,950) (39,937)
Net deferred tax asset (liability), current ......................................................... (2,601) 91,372
Noncurrent
Tax credit carry forwards .................................................................................... 19,834 492
Compensation and benefit plans ......................................................................... 101,479 85,122
Partnership investments ...................................................................................... 127,297 159,456
Other ................................................................................................................... 9,097 11,948
Deferred tax asset ............................................................................................ 257,707 257,018
Valuation allowance ............................................................................................ (9,868) (8,854)
Net deferred tax asset, noncurrent ................................................................... 247,839 248,164
Fixed assets and intangibles ................................................................................ (831,312) (793,332)
Investments ......................................................................................................... (41,072) (35,943)
Other assets ......................................................................................................... (18,681) (19,309)
Deferred tax liability, noncurrent .................................................................... (891,065) (848,584)
Net deferred tax liability, noncurrent............................................................... (643,226) (600,420)
Total net deferred tax liability ............................................................................. $(645,827) $(509,048)
The increase in the deferred tax liability with regard to fixed assets from December 31, 2011 to
December 31, 2012 is primarily attributable to the estimated impact of additional first-year bonus
depreciation deductions for federal income tax purposes with regard to certain capital expenditures.
At December 31, 2012, on a stand-alone basis CSC Holdings has fully utilized all NOLs for which a
deferred tax asset had been recorded. A deferred tax asset has not been recorded for NOLs of $30,031
relating to 'windfall' deductions on share-based awards. CSC Holdings uses the 'with-and-without'
approach to determine whether an excess tax benefit has been realized. Upon realization, the excess tax
benefits for these 'windfall' deductions will be recorded as an increase to member's equity. On a stand-
alone basis CSC Holdings realized federal and state excess tax benefit of $61,434 during the year ended
December 31, 2012. Such excess tax benefit resulted in an increase to member's equity. Subsequent to
the utilization of CSC Holdings' NOLs and tax credit carry forwards, obligations to Cablevision pursuant
to the tax allocation policy will increase significantly.
As of December 31, 2012, on a stand-alone basis CSC Holdings has $24,573 of alternative minimum tax
credit carry forwards, which do not expire.