Cablevision 2012 Annual Report Download - page 75
Download and view the complete annual report
Please find page 75 of the 2012 Cablevision annual report below. You can navigate through the pages in the report by either clicking on the pages listed below, or by using the keyword search tool below to find specific information within the annual report.-
 1
1 -
2
-
3
-
4
-
5
-
6
-
7
-
8
-
9
-
10
-
11
-
12
-
13
-
14
-
15
-
16
-
17
-
18
-
19
-
20
-
21
-
22
-
23
-
24
-
25
-
26
-
27
-
28
-
29
-
30
-
31
-
32
-
33
-
34
-
35
-
36
-
37
-
38
-
39
-
40
-
41
-
42
-
43
-
44
-
45
-
46
-
47
-
48
-
49
-
50
-
51
-
52
-
53
-
54
-
55
-
56
-
57
-
58
-
59
-
60
-
61
-
62
-
63
-
64
-
 65
65 -
 66
66 -
 67
67 -
 68
68 -
 69
69 -
 70
70 -
 71
71 -
 72
72 -
 73
73 -
 74
74 -
 75
75 -
 76
76 -
 77
77 -
 78
78 -
 79
79 -
 80
80 -
 81
81 -
 82
82 -
 83
83 -
 84
84 -
 85
85 -
86
-
87
-
88
-
89
-
90
-
91
-
92
-
93
-
94
-
95
-
96
-
97
-
98
-
99
-
100
-
101
-
102
-
103
-
104
-
105
-
106
-
107
-
108
-
109
-
110
-
111
-
112
-
113
-
114
-
115
-
116
-
117
-
118
-
119
-
120
-
121
-
122
-
123
-
124
-
125
-
126
-
127
-
128
-
129
-
130
-
131
-
132
-
133
-
134
-
135
-
136
-
137
-
138
-
139
-
140
-
141
-
142
-
143
-
144
-
145
-
146
-
147
-
148
-
149
-
150
-
151
-
152
-
153
-
154
-
155
-
156
-
157
-
158
-
159
-
160
-
161
-
162
-
163
-
164
-
165
-
166
-
167
-
168
-
169
-
170
-
171
-
172
-
173
-
174
-
175
-
176
-
177
-
178
-
179
-
180
-
181
-
182
-
183
-
184
-
185
-
186
-
187
-
188
-
189
-
190
-
191
-
192
-
193
-
194
-
195
-
196
-
197
-
198
-
199
-
200
-
201
-
202
-
203
-
204
-
205
-
206
-
207
-
208
-
209
-
210
-
211
-
212
-
213
-
214
-
215
-
216
-
217
-
218
-
219
-
220
 |
 |

(69)
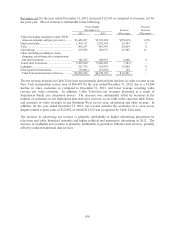
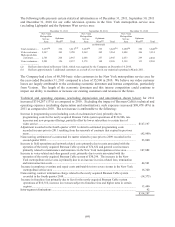
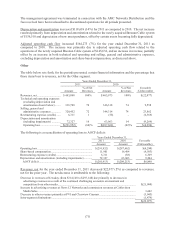
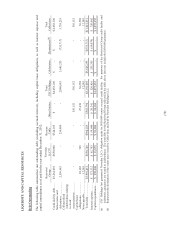
The following table presents certain statistical information as of December 31, 2011, September 30, 2011
and December 31, 2010 for our cable television systems in the New York metropolitan service area
(excluding Lightpath) and the Optimum West service area:
December 31, 2011 September 30, 2011 December 31, 2010
New York
Metropolitan
Service
Area
Optimum
West(a) Total
New York
Metropolitan
Service
Area
Optimum
West(a) Total
New York
Metropolitan
Service
Area
Optimum
West(a) Total
(in thousands)
Total customers .... 3,255(b) 356 3,611(b))3,269(b) 353 3,622(b) 3,298(b) 350 3,648(b)
Video customers .. 2,947 303 3,250 2,962 302 3,264 3,008 306 3,314
High-speed data
customers ......... 2,701 264 2,965 2,688 257 2,945 2,653 239 2,892
Voice customers ... 2,201 156 2,357 2,178 148 2,326 2,138 131 2,269
________________
(a) Reflects data related to Bresnan Cable, which was acquired by the Company on December 14, 2010.
(b) Reflects approximately 3 additional customers as a result of a revision in our statistical reporting in March 2011.
The Company had a loss of 60,300 basic video customers in the New York metropolitan service area for
the year ended December 31, 2011 compared to a loss of 55,500 in 2010. We believe our video customer
losses are largely attributable to the continuing economic downturn and intense competition, particularly
from Verizon. The length of the economic downturn and this intense competition could continue to
impact our ability to maintain or increase our existing customers and revenue in the future.
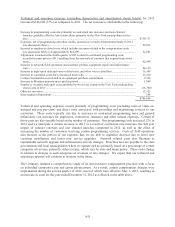
Technical and operating expenses (excluding depreciation and amortization shown below) for 2011
increased $314,287 (13%) as compared to 2010. Excluding the impact of Bresnan Cable's technical and
operating expenses (excluding depreciation and amortization), such expenses increased $98,478 (4%) in
2011 as compared to 2010. The net increase is attributable to the following:
Increase in programming costs (including costs of on-demand services) primarily due to
programming costs for the newly acquired Bresnan Cable system operations of $114,946, rate
increases and new program offerings, partially offset by lower subscribers to certain tiers of
video service .......................................................................................................................................
.
$167,197
Adjustment recorded in the fourth quarter of 2011 related to estimated programming costs
recorded in years prior to 2011 resulting from the renewals of contracts that expired in previous
years ....................................................................................................................................................
.
(42,900)
Nonrecurring settlement of a contractual fee matter related to years prior to 2009 recorded in the
second quarter 2010............................................................................................................................
.
23,000
Increase in field operations and network related costs primarily due to costs associated with the
operation of the newly acquired Bresnan Cable system of $74,632 and general cost increases
primarily related to maintenance and insurance in the New York metropolitan service area .............
.
107,082
Increase in voice-related and other general costs, primarily due to costs associated with the
operation of the newly acquired Bresnan Cable system of $30,296. The increase in the New
York metropolitan service area is primarily due to an increase in voice-related fees, termination
and interconnection costs ....................................................................................................................
.
44,541
Increase in employee overtime and repair costs attributable to two severe storms in the New York
metropolitan service area ...................................................................................................................
.
16,300
Nonrecurring contract termination charge related to the newly acquired Bresnan Cable system
recorded in the fourth quarter 2010 ....................................................................................................
.
(14,375)
Increase in franchise fees primarily due to fees for the newly acquired Bresnan Cable system
operations of $10,310, increase in revenues subject to franchise fees and higher rates in certain
regions ................................................................................................................................................
.
13,400
Intra-segment eliminations ....................................................................................................................
.
42
$314,287