Cablevision 2012 Annual Report Download - page 149
Download and view the complete annual report
Please find page 149 of the 2012 Cablevision annual report below. You can navigate through the pages in the report by either clicking on the pages listed below, or by using the keyword search tool below to find specific information within the annual report.-
 1
1 -
2
-
3
-
4
-
5
-
6
-
7
-
8
-
9
-
10
-
11
-
12
-
13
-
14
-
15
-
16
-
17
-
18
-
19
-
20
-
21
-
22
-
23
-
24
-
25
-
26
-
27
-
28
-
29
-
30
-
31
-
32
-
33
-
34
-
35
-
36
-
37
-
38
-
39
-
40
-
41
-
42
-
43
-
44
-
45
-
46
-
47
-
48
-
49
-
50
-
51
-
52
-
53
-
54
-
55
-
56
-
57
-
58
-
59
-
60
-
61
-
62
-
63
-
64
-
65
-
66
-
67
-
68
-
69
-
70
-
71
-
72
-
73
-
74
-
75
-
76
-
77
-
78
-
79
-
80
-
81
-
82
-
83
-
84
-
85
-
86
-
87
-
88
-
89
-
90
-
91
-
92
-
93
-
94
-
95
-
96
-
97
-
98
-
99
-
100
-
101
-
102
-
103
-
104
-
105
-
106
-
107
-
108
-
109
-
110
-
111
-
112
-
113
-
114
-
115
-
116
-
117
-
118
-
119
-
120
-
121
-
122
-
123
-
124
-
125
-
126
-
127
-
128
-
129
-
130
-
131
-
132
-
133
-
134
-
135
-
136
-
137
-
138
-
 139
139 -
 140
140 -
 141
141 -
 142
142 -
 143
143 -
 144
144 -
 145
145 -
 146
146 -
 147
147 -
 148
148 -
 149
149 -
 150
150 -
 151
151 -
 152
152 -
 153
153 -
 154
154 -
 155
155 -
 156
156 -
 157
157 -
 158
158 -
 159
159 -
160
-
161
-
162
-
163
-
164
-
165
-
166
-
167
-
168
-
169
-
170
-
171
-
172
-
173
-
174
-
175
-
176
-
177
-
178
-
179
-
180
-
181
-
182
-
183
-
184
-
185
-
186
-
187
-
188
-
189
-
190
-
191
-
192
-
193
-
194
-
195
-
196
-
197
-
198
-
199
-
200
-
201
-
202
-
203
-
204
-
205
-
206
-
207
-
208
-
209
-
210
-
211
-
212
-
213
-
214
-
215
-
216
-
217
-
218
-
219
-
220
 |
 |

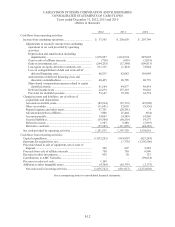
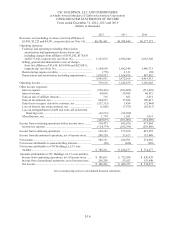
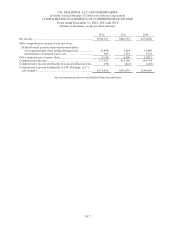
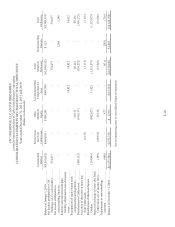
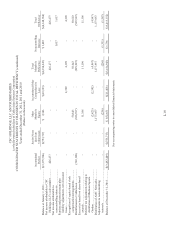
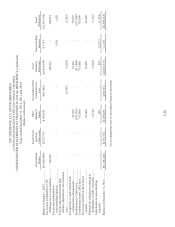
CSC HOLDINGS, LLC AND SUBSIDIARIES
(a wholly-owned subsidiary of Cablevision Systems Corporation)
CONSOLIDATED STATEMENTS OF CASH FLOWS
Years ended December 31, 2012, 2011 and 2010
(Dollars in thousands)
I-21
2012 2011 2010
Cash flows from operating activities:
Income from continuing operations ...................................... $ 186,101 $ 373,078 $ 421,078
Adjustments to reconcile income from continuing
operations to net cash provided by operating
activities:
Depreciation and amortization (including
impairments) .............................................................. 1,078,957 1,014,974 887,092
Gain on sale of affiliate interests .................................... (716) (683) (2,051)
Gain on investments, net ................................................ (294,235) (37,384) (109,813)
Loss (gain) on equity derivative contracts, net .............. 211,335 (1,454) 72,044
Loss on extinguishment of debt and write-off of
deferred financing costs .............................................. 66,213 92,692 -
Amortization of deferred financing costs and
discounts on indebtedness .......................................... 34,116 41,186 35,324
Accretion of discount on Cablevision senior notes
held by Newsday ........................................................ - - (3,131)
Share-based compensation expense related to equity
classified awards ........................................................ 61,564 44,877 48,434
Deferred income taxes ................................................... 83,531 253,404 223,895
Provision for doubtful accounts ..................................... 53,147 57,330 63,574
Excess tax benefit on share-based awards ..................... (61,434) (11,196) -
Change in assets and liabilities, net of effects of
acquisitions and dispositions:
Accounts receivable, trade ................................................. (82,934) (57,133) (81,909)
Other receivables ............................................................... (3,841) 13,683 (8,127)
Prepaid expenses and other assets ..................................... 47,593 (28,241) 4,460
Advances/payables to affiliates ......................................... 800 16,957 21,459
Accounts payable .............................................................. 14,843 (4,509) 65,886
Accrued liabilities .............................................................. (36,310) (49,469) 17,972
Deferred revenue ............................................................... 1,987 9,500 (3,997)
Derivative contracts ........................................................... (55,383) (111,895) (44,183)
Net cash provided by operating activities ............................. 1,305,334 1,615,717 1,608,007
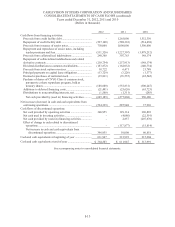
Cash flows from investing activities:
Capital expenditures .............................................................. (1,075,255) (814,807) (823,245)
Payments for acquisitions, net ............................................... - (7,776) (1,356,500)
Proceeds related to sale of equipment, net of costs of
disposal .............................................................................. 362 667 2,382
Proceeds from sale of affiliate interests ................................ 750 750 6,990
Decrease in other investments ............................................... 955 50 133
Contributions to AMC Networks .......................................... - - (99,614)
Decrease in restricted cash .................................................... 1,149 - -
Additions to other intangible assets ...................................... (4,704) (10,797) (2,175)
Net cash used in investing activities .................................. (1,076,743) (831,913) (2,272,029)
See accompanying notes to consolidated financial statements.