Cablevision 2012 Annual Report Download - page 45
Download and view the complete annual report
Please find page 45 of the 2012 Cablevision annual report below. You can navigate through the pages in the report by either clicking on the pages listed below, or by using the keyword search tool below to find specific information within the annual report.-
 1
1 -
2
-
3
-
4
-
5
-
6
-
7
-
8
-
9
-
10
-
11
-
12
-
13
-
14
-
15
-
16
-
17
-
18
-
19
-
20
-
21
-
22
-
23
-
24
-
25
-
26
-
27
-
28
-
29
-
30
-
31
-
32
-
33
-
34
-
 35
35 -
 36
36 -
 37
37 -
 38
38 -
 39
39 -
 40
40 -
 41
41 -
 42
42 -
 43
43 -
 44
44 -
 45
45 -
 46
46 -
 47
47 -
 48
48 -
 49
49 -
 50
50 -
 51
51 -
 52
52 -
 53
53 -
 54
54 -
 55
55 -
56
-
57
-
58
-
59
-
60
-
61
-
62
-
63
-
64
-
65
-
66
-
67
-
68
-
69
-
70
-
71
-
72
-
73
-
74
-
75
-
76
-
77
-
78
-
79
-
80
-
81
-
82
-
83
-
84
-
85
-
86
-
87
-
88
-
89
-
90
-
91
-
92
-
93
-
94
-
95
-
96
-
97
-
98
-
99
-
100
-
101
-
102
-
103
-
104
-
105
-
106
-
107
-
108
-
109
-
110
-
111
-
112
-
113
-
114
-
115
-
116
-
117
-
118
-
119
-
120
-
121
-
122
-
123
-
124
-
125
-
126
-
127
-
128
-
129
-
130
-
131
-
132
-
133
-
134
-
135
-
136
-
137
-
138
-
139
-
140
-
141
-
142
-
143
-
144
-
145
-
146
-
147
-
148
-
149
-
150
-
151
-
152
-
153
-
154
-
155
-
156
-
157
-
158
-
159
-
160
-
161
-
162
-
163
-
164
-
165
-
166
-
167
-
168
-
169
-
170
-
171
-
172
-
173
-
174
-
175
-
176
-
177
-
178
-
179
-
180
-
181
-
182
-
183
-
184
-
185
-
186
-
187
-
188
-
189
-
190
-
191
-
192
-
193
-
194
-
195
-
196
-
197
-
198
-
199
-
200
-
201
-
202
-
203
-
204
-
205
-
206
-
207
-
208
-
209
-
210
-
211
-
212
-
213
-
214
-
215
-
216
-
217
-
218
-
219
-
220
 |
 |

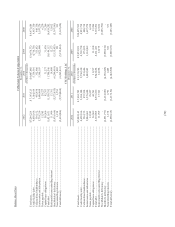
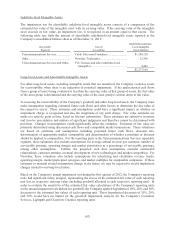
(39)
Balance Sheet Data:
Cablevision Systems Corporation
December 31,
2012 2011 2010 2009 2008
(Dollars in thousands)
Total assets ......................................................................................................... $7,246,224 $ 7,143,325 $ 8,867,092 $ 9,676,772 $ 9,971,684
Credit facility debt .............................................................................................. 4, 658,106 5,184,194 5,756,510 4,718,750 4,953,750
Collateralized indebtedness ................................................................................ 556,152 455,938 352,606 375,832 448,738
Senior notes and debentures ............................................................................... 5,738,219 5,446,660 5,568,193 5,022,600 5,197,278
Notes payable ..................................................................................................... 12,585 29,227 - - 6,230
Capital lease obligations ..................................................................................... 56,569 42,763 31,237 31,930 33,286
Total debt ........................................................................................................... 11,021,631 11,158,782 11,708,546 10,149,112 10,639,282
Redeemable noncontrolling interest ................................................................... 11,999 13,761 14,698 12,175 12,012
Stockholders' deficiency ..................................................................................... (5,639,164) (5,575,855) (6,296,918) (5,155,955) (5,367,991)
Noncontrolling interests ..................................................................................... 1,158 1,791 1,485 521 333
Total deficiency .................................................................................................. (5,638,006) (5,574,064) (6,295,433) (5,155,434) (5,367,658)
CSC Holdings, LLC
December 31,
2012 2011 2010 2009 2008
(Dollars in thousands)
Total assets ......................................................................................................... $7,448,145 $ 7,601,785 $ 9,172,292 $ 9,872,523 $10,225,595
Credit facility debt .............................................................................................. 4, 658,106 5,184,194 5,756,510 4,718,750 4,953,750
Collateralized indebtedness ................................................................................ 556,152 455,938 352,606 375,832 448,738
Senior notes and debentures ............................................................................... 2,846,683 3,279,694 3,402,505 3,134,909 3,697,278
Notes payable ..................................................................................................... 12,585 29,227 - - 6,230
Capital lease obligations ..................................................................................... 56,569 42,763 31,237 31,930 33,286
Total debt ........................................................................................................... 8,130,095 8,991,816 9,542,858 8,261,421 9,139,282
Redeemable noncontrolling interest ................................................................... 11,999 13,761 14,698 12,175 12,012
Stockholder's deficiency ..................................................................................... - - - - (3,603,782)
Member's deficiency .......................................................................................... (2,851,773) (3,414,943) (4,150,245) (3,090,152) -
Noncontrolling interests ..................................................................................... 1,158 1,791 1,485 521 333
Total deficiency .................................................................................................. (2, 850,615) (3,413,152) (4,148,760) (3,089,631) (3,603,449)