Cablevision 2012 Annual Report Download - page 9
Download and view the complete annual report
Please find page 9 of the 2012 Cablevision annual report below. You can navigate through the pages in the report by either clicking on the pages listed below, or by using the keyword search tool below to find specific information within the annual report.-
 1
1 -
 2
2 -
 3
3 -
 4
4 -
 5
5 -
 6
6 -
 7
7 -
 8
8 -
 9
9 -
 10
10 -
 11
11 -
 12
12 -
 13
13 -
 14
14 -
 15
15 -
 16
16 -
 17
17 -
 18
18 -
 19
19 -
 20
20 -
21
-
22
-
23
-
24
-
25
-
26
-
27
-
28
-
29
-
30
-
31
-
32
-
33
-
34
-
35
-
36
-
37
-
38
-
39
-
40
-
41
-
42
-
43
-
44
-
45
-
46
-
47
-
48
-
49
-
50
-
51
-
52
-
53
-
54
-
55
-
56
-
57
-
58
-
59
-
60
-
61
-
62
-
63
-
64
-
65
-
66
-
67
-
68
-
69
-
70
-
71
-
72
-
73
-
74
-
75
-
76
-
77
-
78
-
79
-
80
-
81
-
82
-
83
-
84
-
85
-
86
-
87
-
88
-
89
-
90
-
91
-
92
-
93
-
94
-
95
-
96
-
97
-
98
-
99
-
100
-
101
-
102
-
103
-
104
-
105
-
106
-
107
-
108
-
109
-
110
-
111
-
112
-
113
-
114
-
115
-
116
-
117
-
118
-
119
-
120
-
121
-
122
-
123
-
124
-
125
-
126
-
127
-
128
-
129
-
130
-
131
-
132
-
133
-
134
-
135
-
136
-
137
-
138
-
139
-
140
-
141
-
142
-
143
-
144
-
145
-
146
-
147
-
148
-
149
-
150
-
151
-
152
-
153
-
154
-
155
-
156
-
157
-
158
-
159
-
160
-
161
-
162
-
163
-
164
-
165
-
166
-
167
-
168
-
169
-
170
-
171
-
172
-
173
-
174
-
175
-
176
-
177
-
178
-
179
-
180
-
181
-
182
-
183
-
184
-
185
-
186
-
187
-
188
-
189
-
190
-
191
-
192
-
193
-
194
-
195
-
196
-
197
-
198
-
199
-
200
-
201
-
202
-
203
-
204
-
205
-
206
-
207
-
208
-
209
-
210
-
211
-
212
-
213
-
214
-
215
-
216
-
217
-
218
-
219
-
220
 |
 |

(3)
Telecommunications Services Segment, and approximately $2.5 million for our Other Segment. In
addition to these costs, we experienced other negative financial impacts including lower revenue related
to customers for whom we decided to temporarily suspend billing during the restoration of their homes,
displaced homes and advertising cancelations. We expect insurance recoveries related to storm damage
and business interruption to be minimal.
For several weeks after the storm, our workforce was dedicated to restoring services to our customers as
quickly as possible. During this period we reduced our marketing and sales activities which resulted in
lower sales and lower new customer connections. We also suspended our normal non-pay collection
procedures and disconnect policy to focus our customer service representatives and field service
technicians on service restoration. As a result, our customer statistics include delinquent customer
accounts that exceed our normal disconnect date. Of these delinquent accounts, we estimated the number
of accounts that we believe will be disconnected in 2013 as our normal collection and disconnect
procedures resume and our customer counts as of December 31, 2012 have been reduced accordingly.
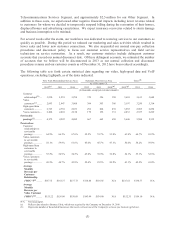
The following table sets forth certain statistical data regarding our video, high-speed data and VoIP
operations, excluding Lightpath, as of the dates indicated:
New York Metropolitan Service Area Optimum West Service Area Total (f)
As of December 31,
2012(g) 2011 2010 2012 2011 2010(a) 2012(g) 2011 2010
(in thousands, except per customer amounts)
Customer
relationships(b) .... 3,230 3,255 3,298 370 356 350 3,601 3,611 3,648
Video
customers(c) ........ 2,893 2,947 3,008 304 303 306 3,197 3,250 3,314
High-speed data
customers ............ 2,763 2,701 2,653 292 264 239 3,055 2,965 2,892
Voice customers .... 2,264 2,201 2,138 170 156 131 2,433 2,357 2,269
Serviceable
passings(d) ............ 4,979 4,922 4,882 667 662 650 5,646 5,584 5,532
Penetration:
Customer
relationships to
serviceable
passings ............... 64.9% 66.1% 67.6% 55.5% 53.7% 53.8% 63.8% 64.7% 65.9%
Video customers
to serviceable
passings ............... 58.1% 59.9% 61.6% 45.6% 45.7% 47.1% 56.6% 58.2% 59.9%
High-speed data
customers to
serviceable
passings ............... 55.5% 54.9% 54.3% 43.8% 39.9% 36.8% 54.1% 53.1% 52.3%
Voice customers
to serviceable
passings ............... 45.5% 44.7% 43.8% 25.4% 23.5% 20.2% 43.1% 42.2% 41.0%
Average
Monthly
Revenue per
Customer
Relationship
("RPC")(e) ......... $137.51 $141.37 $137.73 $118.84 $114.85 N/A $135.61 $138.77 N/A
Average
Monthly
Revenue per
Video Customer
("RPS")(e) .......... $153.22 $156.09 $150.68 $143.99 $134.60 N/A $152.35 $154.10 N/A
________________
N/A Not meaningful.
(a) Reflects data related to Bresnan Cable, which was acquired by the Company on December 14, 2010.
(b) Represents number of households/businesses that receive at least one of the Company's services (see footnote (g) below).