Cablevision 2012 Annual Report Download - page 44
Download and view the complete annual report
Please find page 44 of the 2012 Cablevision annual report below. You can navigate through the pages in the report by either clicking on the pages listed below, or by using the keyword search tool below to find specific information within the annual report.-
 1
1 -
2
-
3
-
4
-
5
-
6
-
7
-
8
-
9
-
10
-
11
-
12
-
13
-
14
-
15
-
16
-
17
-
18
-
19
-
20
-
21
-
22
-
23
-
24
-
25
-
26
-
27
-
28
-
29
-
30
-
31
-
32
-
33
-
 34
34 -
 35
35 -
 36
36 -
 37
37 -
 38
38 -
 39
39 -
 40
40 -
 41
41 -
 42
42 -
 43
43 -
 44
44 -
 45
45 -
 46
46 -
 47
47 -
 48
48 -
 49
49 -
 50
50 -
 51
51 -
 52
52 -
 53
53 -
 54
54 -
55
-
56
-
57
-
58
-
59
-
60
-
61
-
62
-
63
-
64
-
65
-
66
-
67
-
68
-
69
-
70
-
71
-
72
-
73
-
74
-
75
-
76
-
77
-
78
-
79
-
80
-
81
-
82
-
83
-
84
-
85
-
86
-
87
-
88
-
89
-
90
-
91
-
92
-
93
-
94
-
95
-
96
-
97
-
98
-
99
-
100
-
101
-
102
-
103
-
104
-
105
-
106
-
107
-
108
-
109
-
110
-
111
-
112
-
113
-
114
-
115
-
116
-
117
-
118
-
119
-
120
-
121
-
122
-
123
-
124
-
125
-
126
-
127
-
128
-
129
-
130
-
131
-
132
-
133
-
134
-
135
-
136
-
137
-
138
-
139
-
140
-
141
-
142
-
143
-
144
-
145
-
146
-
147
-
148
-
149
-
150
-
151
-
152
-
153
-
154
-
155
-
156
-
157
-
158
-
159
-
160
-
161
-
162
-
163
-
164
-
165
-
166
-
167
-
168
-
169
-
170
-
171
-
172
-
173
-
174
-
175
-
176
-
177
-
178
-
179
-
180
-
181
-
182
-
183
-
184
-
185
-
186
-
187
-
188
-
189
-
190
-
191
-
192
-
193
-
194
-
195
-
196
-
197
-
198
-
199
-
200
-
201
-
202
-
203
-
204
-
205
-
206
-
207
-
208
-
209
-
210
-
211
-
212
-
213
-
214
-
215
-
216
-
217
-
218
-
219
-
220
 |
 |

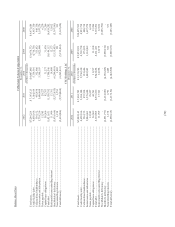
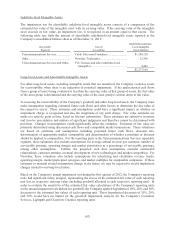
(38)
CSC Holdings, LLC
Years Ended December 31,
2012 2011 2010(a) 2009 2008
(Dollars in thousands)
Revenues, net ..................................................................................................... $6,705,461 $6,700,848 $6,177,575 $5,900,074 $5,480,799
Operating expenses:
Technical and operating (excluding depreciation, amortization and
impairments shown below) ......................................................................... 3,323,655 2,968,540 2,663,748 2,532,844 2,391,392
Selling, general and administrative................................................................. 1,544,109 1,482,344 1,440,731 1,389,525 1,253,863
Restructuring expense (credits) ...................................................................... (770) 6,311 (58) 5,583 3,049
Depreciation and amortization (including impairments) ................................ 1,078,957 1,014,974 887,092 916,408 1,333,101
Operating income ............................................................................................... 759,510 1,228,679 1,186,062 1,055,714 499,394
Other income (expense):
Interest expense, net ....................................................................................... (466,380) (503,124) (470,338) (493,672) (536,287)
Gain on sale of affiliate interests .................................................................... 716 683 2,051 - -
Gain (loss) on investments, net ....................................................................... 294,235 37,384 109,813 (977) (33,176)
Gain (loss) on equity derivative contracts, net ................................................ (211,335) 1,454 (72,044) 631 51,772
Loss on interest rate swap contracts, net ......................................................... (1,828) (7,973) (85,013) (75,631) (202,840)
Loss on extinguishment of debt and write-off of deferred financing costs ..... (66,213) (92,692) - (72,870) -
Miscellaneous, net .......................................................................................... 1,770 1,265 1,433 543 881
Income (loss) from continuing operations before income taxes ......................... 310,475 665,676 671,964 413,738 (220,256)
Income tax benefit (expense) .......................................................................... (124,374) (292,598) (250,886) (184,255) 54,273
Income (loss) from continuing operations .......................................................... 186,101 373,078 421,078 229,483 (165,983)
Income from discontinued operations, net of income taxes ................................ 200,250 53,623 153,848 161,467 21,600
Net income (loss) ............................................................................................... 386,351 426,701 574,926 390,950 (144,383)
Net loss (income) attributable to noncontrolling interests .................................. (90) (424) (649) 273 8,108
Net income (loss) attributable to CSC Holdings, LLC's sole member ................ $ 386,261 $ 426,277 $ 574,277 $ 391,223 $ (136,275)
Amounts attributable to CSC Holdings, LLC's sole member:
Income (loss) from continuing operations, net of income taxes ................... $ 186,011 $ 372,654 $ 420,429 $ 229,756 $ (157,875)
Income from discontinued operations, net of income taxes .......................... 200,250 53,623 153,848 161,467 21,600
Net income (loss).......................................................................................... $ 386,261 $ 426,277 $ 574,277 $ 391,223 $ (136,275)
________________
(a) Amounts include the operating results of Bresnan Cable from the date of acquisition on December 14, 2010.