Cablevision 2012 Annual Report Download - page 68
Download and view the complete annual report
Please find page 68 of the 2012 Cablevision annual report below. You can navigate through the pages in the report by either clicking on the pages listed below, or by using the keyword search tool below to find specific information within the annual report.-
 1
1 -
2
-
3
-
4
-
5
-
6
-
7
-
8
-
9
-
10
-
11
-
12
-
13
-
14
-
15
-
16
-
17
-
18
-
19
-
20
-
21
-
22
-
23
-
24
-
25
-
26
-
27
-
28
-
29
-
30
-
31
-
32
-
33
-
34
-
35
-
36
-
37
-
38
-
39
-
40
-
41
-
42
-
43
-
44
-
45
-
46
-
47
-
48
-
49
-
50
-
51
-
52
-
53
-
54
-
55
-
56
-
57
-
 58
58 -
 59
59 -
 60
60 -
 61
61 -
 62
62 -
 63
63 -
 64
64 -
 65
65 -
 66
66 -
 67
67 -
 68
68 -
 69
69 -
 70
70 -
 71
71 -
 72
72 -
 73
73 -
 74
74 -
 75
75 -
 76
76 -
 77
77 -
 78
78 -
79
-
80
-
81
-
82
-
83
-
84
-
85
-
86
-
87
-
88
-
89
-
90
-
91
-
92
-
93
-
94
-
95
-
96
-
97
-
98
-
99
-
100
-
101
-
102
-
103
-
104
-
105
-
106
-
107
-
108
-
109
-
110
-
111
-
112
-
113
-
114
-
115
-
116
-
117
-
118
-
119
-
120
-
121
-
122
-
123
-
124
-
125
-
126
-
127
-
128
-
129
-
130
-
131
-
132
-
133
-
134
-
135
-
136
-
137
-
138
-
139
-
140
-
141
-
142
-
143
-
144
-
145
-
146
-
147
-
148
-
149
-
150
-
151
-
152
-
153
-
154
-
155
-
156
-
157
-
158
-
159
-
160
-
161
-
162
-
163
-
164
-
165
-
166
-
167
-
168
-
169
-
170
-
171
-
172
-
173
-
174
-
175
-
176
-
177
-
178
-
179
-
180
-
181
-
182
-
183
-
184
-
185
-
186
-
187
-
188
-
189
-
190
-
191
-
192
-
193
-
194
-
195
-
196
-
197
-
198
-
199
-
200
-
201
-
202
-
203
-
204
-
205
-
206
-
207
-
208
-
209
-
210
-
211
-
212
-
213
-
214
-
215
-
216
-
217
-
218
-
219
-
220
 |
 |

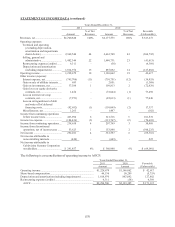
(62)
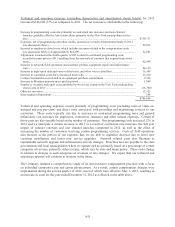
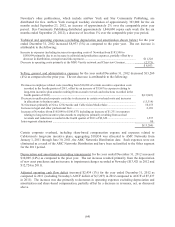
Selling, general and administrative expenses increased $73,819 (6%) for 2012 as compared to 2011. The
net increase is attributable to the following:
Increase in employee related costs, which includes increases related to the compensation study (see
discussion below) of approximately $19,300 .....................................................................................
.
$55,181
Expenses incurred as a result of Superstorm Sandy in 2012 (see discussion above) .............................
.
15,338
Increase in share-based compensation expense .....................................................................................
.
15,140
Decrease in advertising and marketing costs .........................................................................................
.
(9,471)
Decrease in customer payment processing fees related to a reduction in rates ......................................
.
(6,715)
Executive separation costs in the fourth quarter of 2011 .......................................................................
.
(3,040)
Employee overtime attributed to two severe storms in the New York metropolitan service area in
2011 ....................................................................................................................................................
.
(3,800)
Other net increases, including allocations of corporate overhead costs .................................................
.
11,206
Intra-segment eliminations ....................................................................................................................
.
(20)
$73,819
Selling, general and administrative expenses include customer related costs, principally from the
operation and maintenance of our call center facilities that handle customer inquiries and billing and
collection activities. These costs generally rise as the number of customers grow and also as a result of
general inflationary cost increases for employees and various other expenses. Sales and marketing costs
primarily consist of employee costs and advertising production and placement costs associated with
acquiring and retaining customers. These costs vary period to period and may increase with intense
competition.
The Company initiated a comprehensive study of its non-executive compensation practices with a focus
on individual competitive pay and career advancement. As a result, certain compensation changes were
implemented during the second quarter of 2012, most of which were effective May 1, 2012, resulting in
an increase in costs for the year ended December 31, 2012 as reflected in the table above.
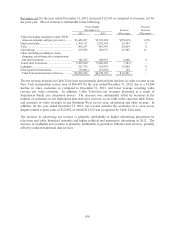
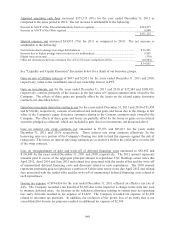
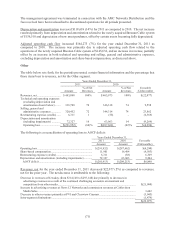
Depreciation and amortization increased $53,978 (6%) for 2012 as compared to 2011. The net increase
resulted primarily from the depreciation of new asset purchases and an increase of $23,189 (including
$1,462 due to Superstorm Sandy) as a result of a change in the estimated useful lives of certain assets,
partially offset by certain assets becoming fully depreciated.
Adjusted operating cash flow decreased $392,746 (16%) for the year ended December 31, 2012 as
compared to 2011. The decrease was due primarily to an increase in both technical and operating and
selling, general and administrative expenses, excluding depreciation and amortization and share-based
compensation, partially offset by an increase in revenue, net, as discussed above.