Cablevision 2012 Annual Report Download - page 191
Download and view the complete annual report
Please find page 191 of the 2012 Cablevision annual report below. You can navigate through the pages in the report by either clicking on the pages listed below, or by using the keyword search tool below to find specific information within the annual report.-
 1
1 -
2
-
3
-
4
-
5
-
6
-
7
-
8
-
9
-
10
-
11
-
12
-
13
-
14
-
15
-
16
-
17
-
18
-
19
-
20
-
21
-
22
-
23
-
24
-
25
-
26
-
27
-
28
-
29
-
30
-
31
-
32
-
33
-
34
-
35
-
36
-
37
-
38
-
39
-
40
-
41
-
42
-
43
-
44
-
45
-
46
-
47
-
48
-
49
-
50
-
51
-
52
-
53
-
54
-
55
-
56
-
57
-
58
-
59
-
60
-
61
-
62
-
63
-
64
-
65
-
66
-
67
-
68
-
69
-
70
-
71
-
72
-
73
-
74
-
75
-
76
-
77
-
78
-
79
-
80
-
81
-
82
-
83
-
84
-
85
-
86
-
87
-
88
-
89
-
90
-
91
-
92
-
93
-
94
-
95
-
96
-
97
-
98
-
99
-
100
-
101
-
102
-
103
-
104
-
105
-
106
-
107
-
108
-
109
-
110
-
111
-
112
-
113
-
114
-
115
-
116
-
117
-
118
-
119
-
120
-
121
-
122
-
123
-
124
-
125
-
126
-
127
-
128
-
129
-
130
-
131
-
132
-
133
-
134
-
135
-
136
-
137
-
138
-
139
-
140
-
141
-
142
-
143
-
144
-
145
-
146
-
147
-
148
-
149
-
150
-
151
-
152
-
153
-
154
-
155
-
156
-
157
-
158
-
159
-
160
-
161
-
162
-
163
-
164
-
165
-
166
-
167
-
168
-
169
-
170
-
171
-
172
-
173
-
174
-
175
-
176
-
177
-
178
-
179
-
180
-
 181
181 -
 182
182 -
 183
183 -
 184
184 -
 185
185 -
 186
186 -
 187
187 -
 188
188 -
 189
189 -
 190
190 -
 191
191 -
 192
192 -
 193
193 -
 194
194 -
 195
195 -
 196
196 -
 197
197 -
 198
198 -
 199
199 -
 200
200 -
 201
201 -
202
-
203
-
204
-
205
-
206
-
207
-
208
-
209
-
210
-
211
-
212
-
213
-
214
-
215
-
216
-
217
-
218
-
219
-
220
 |
 |

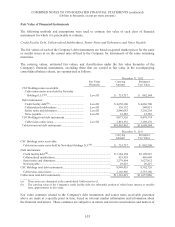
COMBINED NOTES TO CONSOLIDATED FINANCIAL STATEMENTS (continued)
(Dollars in thousands, except per share amounts)
I-63
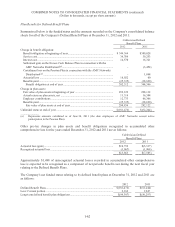
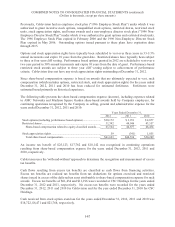
Components of the net periodic benefit cost, recorded primarily in selling, general and administrative
expenses, for the Defined Benefit Plans for the years ended December 31, 2012, 2011 and 2010, are as
follows:
Cablevision Defined Benefit Plans
2012 2011(a) 2010(a)
Service cost ............................................................................... $39,789 $ 39,253 $40,786
Interest cost ............................................................................... 14,570 16,321 14,354
Expected return on plan assets, net ........................................... (9,127) (10,816) (6,116)
Recognized actuarial loss ......................................................... 752 1,583 5,831
Settlement loss ......................................................................... 315 - -
Net periodic benefit cost ........................................................... $46,299 $ 46,341 $54,855
________________
(a) Includes net periodic benefit costs of approximately $2,332 and $4,988 for the years ended December 31, 2011, and
2010, respectively, relating to AMC Networks employees, that are reflected as a component of discontinued
operations in the Company's consolidated financial statements.
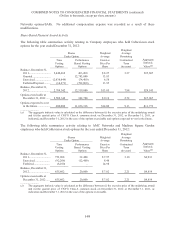
Plan Assumptions for Defined Benefit Plans
Weighted-average assumptions used to determine net periodic cost (made at the beginning of the year)
and benefit obligations (made at the end of the year) for the Defined Benefit Plans are as follows:
Weighted-Average Assumptions
Net Periodic Benefit Cost for the
Years Ended December 31,
Benefit Obligations at
December 31,
2012 2011 2010 2012 2011
Discount rate ..................
.
4.32% 5.25% 5.17% 3.67% 4.32%
Rate of increase in
future compensation
levels ..........................
.
3.50% 3.50% 3.50% 3.50% 3.50%
Expected rate of return
on plan assets
(Pension Plan only) ....
.
3.76% 5.04% 4.38% N/A N/A
The discount rate used by the Company in calculating the net periodic benefit cost for the Pension Plan
and Excess Cash Balance Plan was determined based on the expected future benefit payments for the
pension plans and from the Towers Watson U.S. Rate Link: 40-90 Discount Rate Model as of
December 31, 2012 and from the Buck Consultants' Discount Rate Model as of December 31, 2011 and
2010. Both models were developed by examining the yields on selected highly rated corporate bonds.
In December 2010, the Pension Plan's actuary completed an experience study of the demographic
assumptions used in the actuarial valuation of the Pension Plan. The assumptions reviewed included the
expected rates of termination and retirement, as well as the assumed timing of benefit commencements
and lump sum utilization rates. Based on this analysis, the actuary developed revised demographic
assumptions, which were utilized in calculating the benefit obligations as of December 31, 2010. The use
of the revised assumptions resulted in an increase in the Pension Plan's expected duration of benefit
payments as compared to the previous years.
The Company's expected long-term return on Pension Plan assets is based on a periodic review and
modeling of the plan's asset allocation structure over a long-term horizon. Expectations of returns for
each asset class are the most important of the assumptions used in the review and modeling and are based
on comprehensive reviews of historical data, forward looking economic outlook, and economic/financial
market theory. The expected long-term rate of returns were selected from within the reasonable range of