Cablevision 2012 Annual Report Download - page 67
Download and view the complete annual report
Please find page 67 of the 2012 Cablevision annual report below. You can navigate through the pages in the report by either clicking on the pages listed below, or by using the keyword search tool below to find specific information within the annual report.-
 1
1 -
2
-
3
-
4
-
5
-
6
-
7
-
8
-
9
-
10
-
11
-
12
-
13
-
14
-
15
-
16
-
17
-
18
-
19
-
20
-
21
-
22
-
23
-
24
-
25
-
26
-
27
-
28
-
29
-
30
-
31
-
32
-
33
-
34
-
35
-
36
-
37
-
38
-
39
-
40
-
41
-
42
-
43
-
44
-
45
-
46
-
47
-
48
-
49
-
50
-
51
-
52
-
53
-
54
-
55
-
56
-
 57
57 -
 58
58 -
 59
59 -
 60
60 -
 61
61 -
 62
62 -
 63
63 -
 64
64 -
 65
65 -
 66
66 -
 67
67 -
 68
68 -
 69
69 -
 70
70 -
 71
71 -
 72
72 -
 73
73 -
 74
74 -
 75
75 -
 76
76 -
 77
77 -
78
-
79
-
80
-
81
-
82
-
83
-
84
-
85
-
86
-
87
-
88
-
89
-
90
-
91
-
92
-
93
-
94
-
95
-
96
-
97
-
98
-
99
-
100
-
101
-
102
-
103
-
104
-
105
-
106
-
107
-
108
-
109
-
110
-
111
-
112
-
113
-
114
-
115
-
116
-
117
-
118
-
119
-
120
-
121
-
122
-
123
-
124
-
125
-
126
-
127
-
128
-
129
-
130
-
131
-
132
-
133
-
134
-
135
-
136
-
137
-
138
-
139
-
140
-
141
-
142
-
143
-
144
-
145
-
146
-
147
-
148
-
149
-
150
-
151
-
152
-
153
-
154
-
155
-
156
-
157
-
158
-
159
-
160
-
161
-
162
-
163
-
164
-
165
-
166
-
167
-
168
-
169
-
170
-
171
-
172
-
173
-
174
-
175
-
176
-
177
-
178
-
179
-
180
-
181
-
182
-
183
-
184
-
185
-
186
-
187
-
188
-
189
-
190
-
191
-
192
-
193
-
194
-
195
-
196
-
197
-
198
-
199
-
200
-
201
-
202
-
203
-
204
-
205
-
206
-
207
-
208
-
209
-
210
-
211
-
212
-
213
-
214
-
215
-
216
-
217
-
218
-
219
-
220
 |
 |

(61)
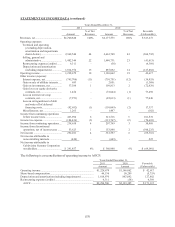
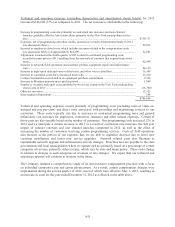
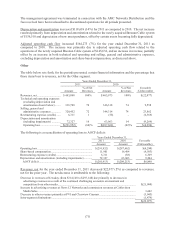
Technical and operating expenses (excluding depreciation and amortization shown below) for 2012
increased $346,608 (13%) as compared to 2011. The net increase is attributable to the following:
Increase in programming costs due primarily to contractual rate increases and new channel
launches, partially offset by lower subscribers primarily in the New York metropolitan service
area .....................................................................................................................................................
.
$130,717
Expenses, net of programming and other credits, incurred as a result of Superstorm Sandy in 2012
(see discussion above) ........................................................................................................................
.
59,013
Increase in employee related costs, which includes increases related to the compensation study
(see discussion below) of approximately $14,100 ..............................................................................
.
52,681
Adjustment recorded in the fourth quarter of 2011 related to estimated programming costs
recorded in years prior to 2011 resulting from the renewals of contracts that expired in previous
years ....................................................................................................................................................
.
42,900
Increase in network, field operations and customer premise equipment repairs and maintenance
costs ....................................................................................................................................................
.
24,119
Increase in high-speed data and voice-related costs, and other voice related fees .................................
.
16,386
Increase in contractor costs due to increased truck rolls ........................................................................
.
13,410
Contract termination cost related to an equipment purchase commitment ............................................
.
9,356
Increase in Montana property taxes paid in protest ...............................................................................
.
1,860
Employee overtime and repair costs attributed to two severe storms in the New York metropolitan
service area in 2011 ............................................................................................................................
.
(16,300)
Other net increases ................................................................................................................................
.
12,322
Intra-segment eliminations ....................................................................................................................
.
144
$346,608
Technical and operating expenses consist primarily of programming costs (including costs of video-on-
demand and pay-per-view) and direct costs associated with providing and maintaining services to our
customers. These costs typically rise due to increases in contractual programming rates and general
inflationary cost increases for employees, contractors, insurance and other various expenses. Certain of
these costs are also variable based on the number of customers. Our programming costs increased 12% in
2012 and we anticipate a similar increase in 2013 as a result of contractual rate increases, the full year
impact of contract renewals and new channel launches completed in 2012, as well as the effect of
increasing the number of customers receiving certain programming services. Costs of field operations
also increase as the portion of our expenses that we are able to capitalize decrease due to lower new
customer installations and lower new service upgrades. Network related costs also fluctuate as
capitalizable network upgrade and enhancement activity changes. Franchise fees are payable to the state
governments and local municipalities where we operate and are primarily based on a percentage of certain
categories of revenue, primarily video revenue, which vary by state and municipality. These costs change
in relation to changes in such categories of revenues or rate changes. We expect that our technical and
operating expenses will continue to increase in the future.
The Company initiated a comprehensive study of its non-executive compensation practices with a focus
on individual competitive pay and career advancement. As a result, certain compensation changes were
implemented during the second quarter of 2012, most of which were effective May 1, 2012, resulting in
an increase in costs for the year ended December 31, 2012 as reflected in the table above.